BrandingUp
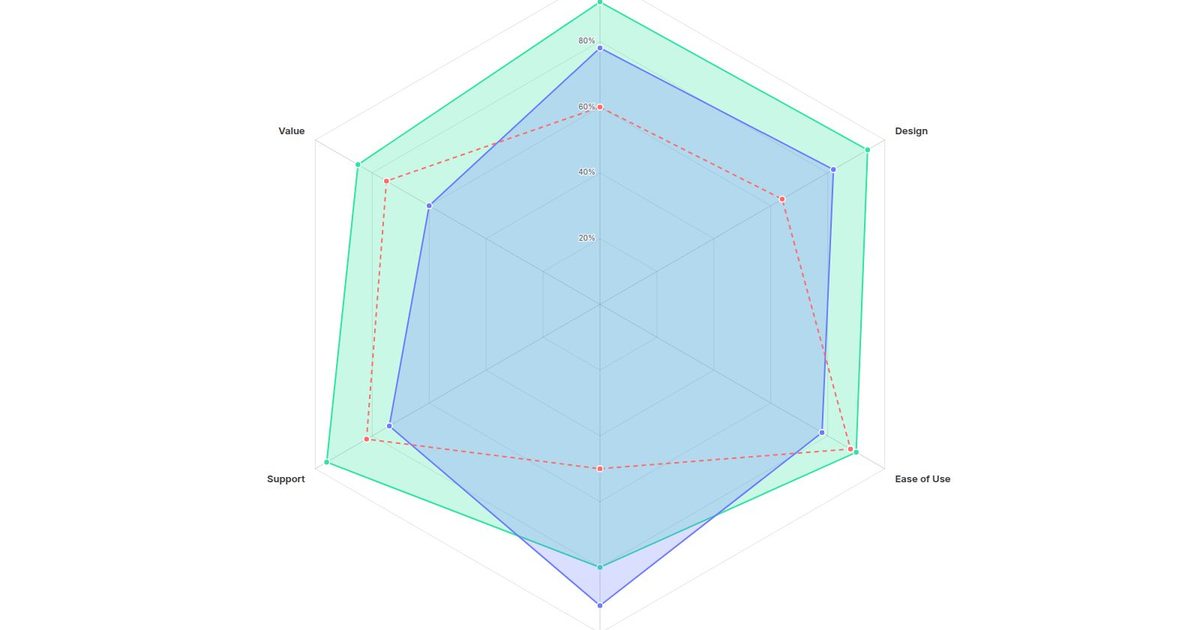
29 Radar Chart
FreeSpider chart with per-axis scales
Searching…
Fluid Spring-Animated Data Grid
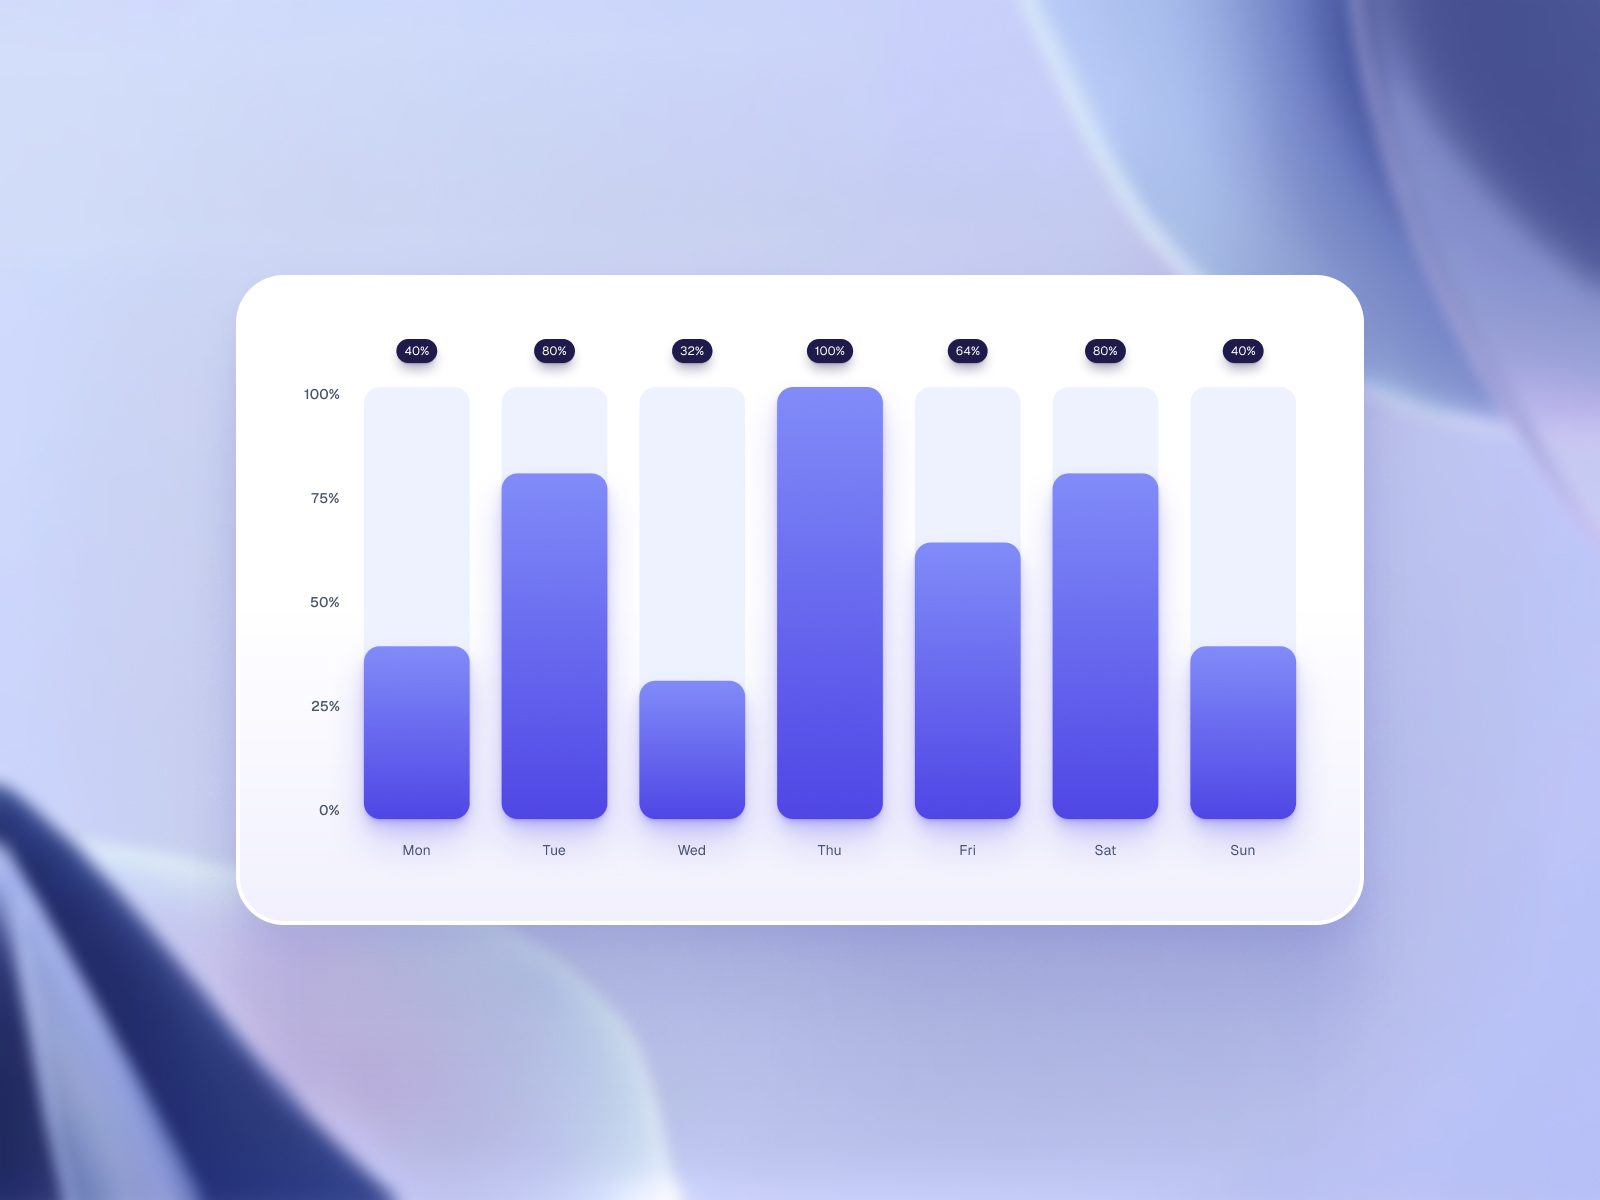
Fluid Spring-Animated Data Grid
The marketplace's most advanced, highly customizable bar chart designed to fluidly animate dynamic metrics and refine your interface's data presentation.
Toggleable weekly and monthly structural layouts for flexible timeframe displays.
Custom mathematical scaling with adjustable Y-axis bounds for strict metric control.
Automated axis boundary swapping for frictionless data entry.
Adjustable bar spring physics for tailored entrance pacing.
Independent bar stagger delays for composed, rhythmic reveals.
Customizable tooltip spring transitions for fluid interaction feedback.
Dedicated tooltip stagger timing for synchronized multi-element rendering.
Dual-tone gradient blending for precise aesthetic alignment.
Solid bar color fills for strict minimal branding.
Customizable underlying track backgrounds for distinct active/inactive contrast.
Adjustable bar and tooltip drop shadows for layered spatial depth.
Configurable bar corner radii for sharp or softened interface aesthetics.
Granular gap controls between individual bars for optimal rhythmic density.
Independent axis and tooltip offset padding for perfectly balanced structural breathing room.
Targeted font controls across all axes and labels for absolute typographic hierarchy.
Customizable numerical prefixes and suffixes for precise context formatting.
Multi-state interactive triggers (hover, click, persistent, hidden) for adaptable user discovery.
Fully customizable tooltip containers (padding, radius, color) for seamless UI integration.
WCAG-compliant keyboard navigation (Enter/Space) for fully accessible interaction.
Dynamic ARIA labeling and component role switching for inclusive screen-reader support.
Drag and drop the component onto your Framer canvas.
Select the Weekly or Monthly view mode and input your metric values.
Configure the component to match your branding.
Publish your project to view your component live.
Transform raw data streams into a fluid, highly interactive experience.