component
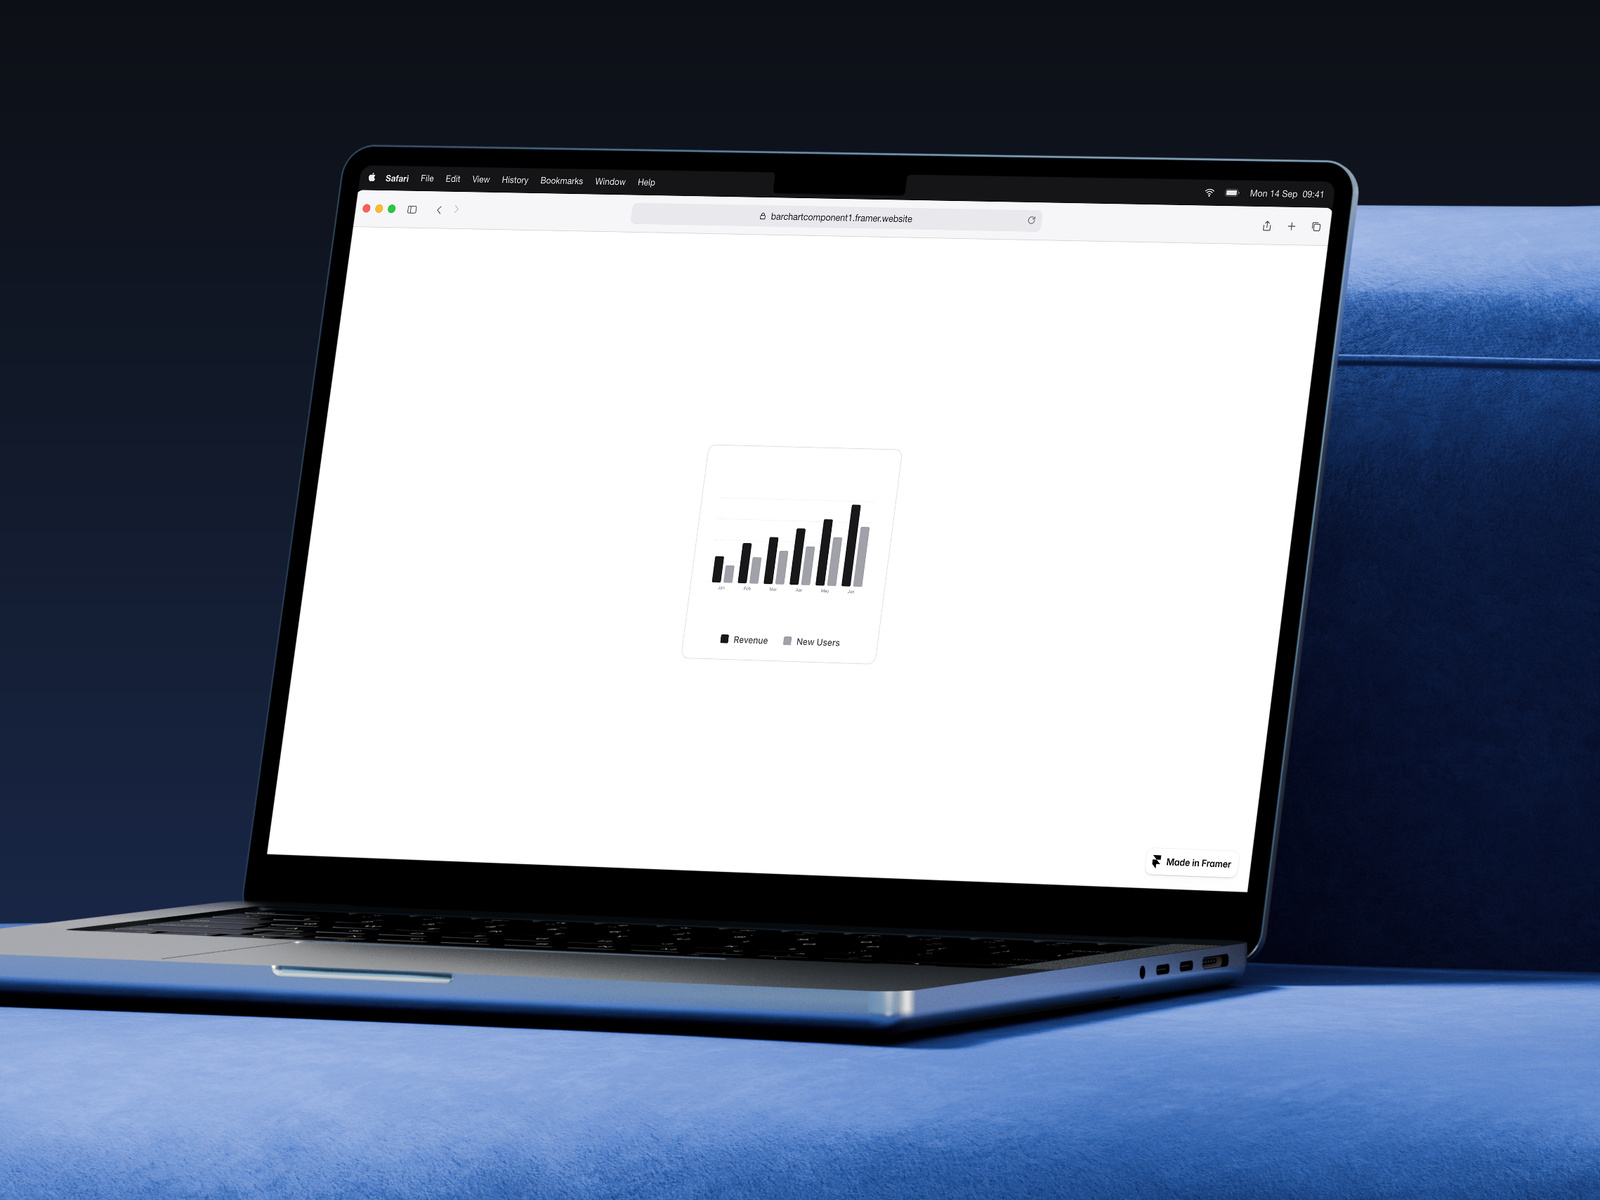
Bar Chart Diagram
By Framer-Expert
Details
- Framer-ExpertAuthor
- componentType
- 2026-02-03Published
- 2026-09-14Updated
- 2026-01-21Added
- ChartsCategories
Summary
Bar Chart — Animated Data Visualisation
Description
A production-ready bar chart built with pure SVG and Framer Motion. Perfect for dashboards, landing pages, and SaaS websites that need to showcase metrics, growth, or comparisons. ✦ Staggered bar animations Bars grow from the baseline with a satisfying spring bounce, each one delayed slightly for a polished sequential reveal. Toggle animations on or off via property controls. ✦ Interactive tooltips Hover over any bar to see detailed values. Tooltips render via portal so they never get clipped by container bounds — works perfectly on all screen sizes. ✦ Fully customizable Control every color, toggle grid lines, axes, legend, and tooltips. Adjust bar radius and gap spacing. All from the property panel — no code required. ✦ Clean, minimal design Styled with a neutral zinc palette that fits any design system. Easily customize to match your brand colors. Features: — Staggered grow-from-bottom bar animations — Spring easing with bounce effect — Hover tooltips with portal rendering (no clipping) — Customizable grid lines — X and Y axis labels (toggleable) — Legend with color indicators — Custom JSON data support — Full color customization — Responsive SVG that scales to container Property Controls: — Primary & secondary bar colors — Background, grid, axis, and text colors — Tooltip background and border colors — Primary & secondary labels — Bar radius and gap — Toggle: Grid, X Axis, Y Axis, Tooltip, Legend, Animation Perfect for: — SaaS dashboards — Pricing page comparisons — Landing page metrics — Growth visualisations — Revenue/user charts — Analytics displays
Introduction
Animated bar chart with tooltips
Rank history
Daily rank per list, from the first snapshot — lower is better.
- All · #6068