component
Context Graph
By Anamika Yadav
Details
- Anamika YadavAuthor
- componentType
- $5.00Price
- 2026-08-19Published
- 2026-08-19Updated
- 2026-08-19Added
- ChartsCategories
Summary
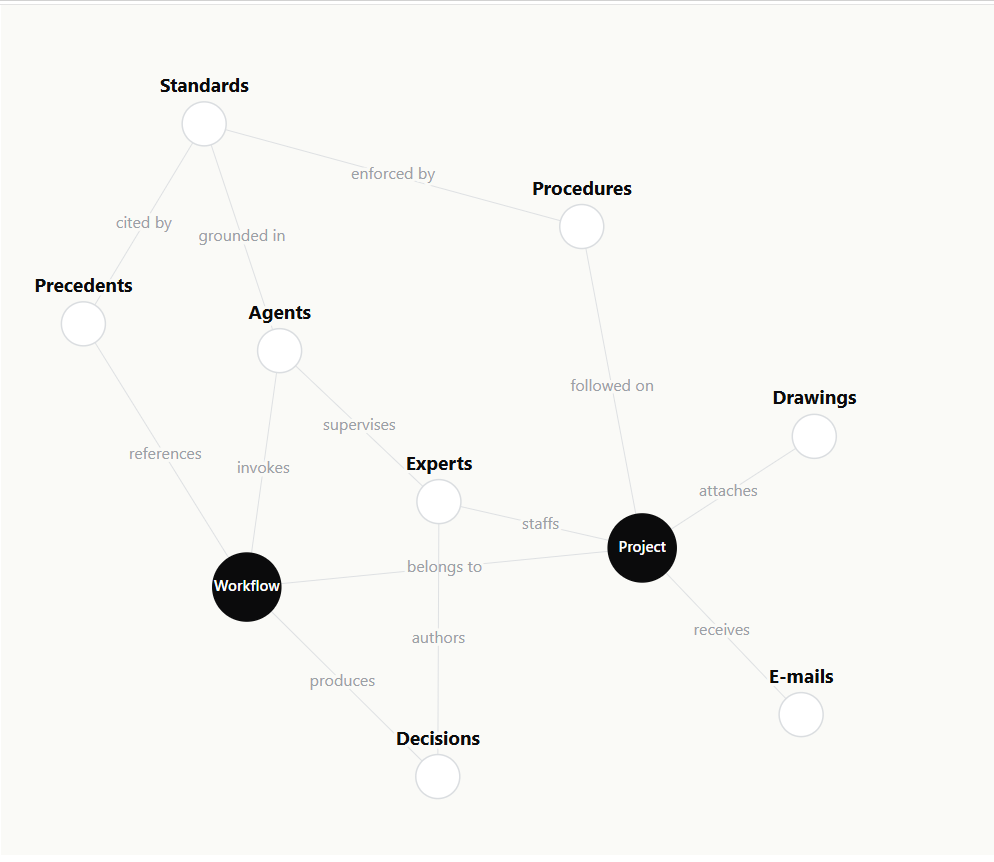
What it does Context Graph creates a visual network of connected nodes with relationship labels, making it easy to communicate how different elements of a system connect and…
Description
What it does Context Graph creates a visual network of connected nodes with relationship labels, making it easy to communicate how different elements of a system connect and interact. Use highlighted nodes to draw attention to key concepts while supporting nodes create context around them. Perfect for AI & technology websites SaaS platforms Knowledge graphs Workflow visualizations Product ecosystems Process diagrams Organizational relationships Data & infrastructure platforms Consulting and enterprise websites Key Features Interactive node-based visualization Custom node names and labels Relationship labels between connections Highlighted primary nodes Clean, minimal visual style Flexible positioning and layout Customizable colors and typography Responsive Framer implementation Ideal for complex systems and workflows No external design tools required Make complex ideas easier to understand Instead of explaining interconnected systems through paragraphs of text, NodeFlow gives visitors a visual overview of how everything fits together. Customize the nodes, relationships, colors, labels, and content to match your product or brand.
Introduction
Node-based relationship graph
Rank history
Daily rank per list, from the first snapshot — lower is better.
- All · #1725