component
Glow Metrics
By Roman Koby
Details
- Roman KobyAuthor
- componentType
- $10.00Price
- 2026-08-18Published
- 2026-08-19Updated
- 2026-08-18Added
- ChartsCategories
Summary
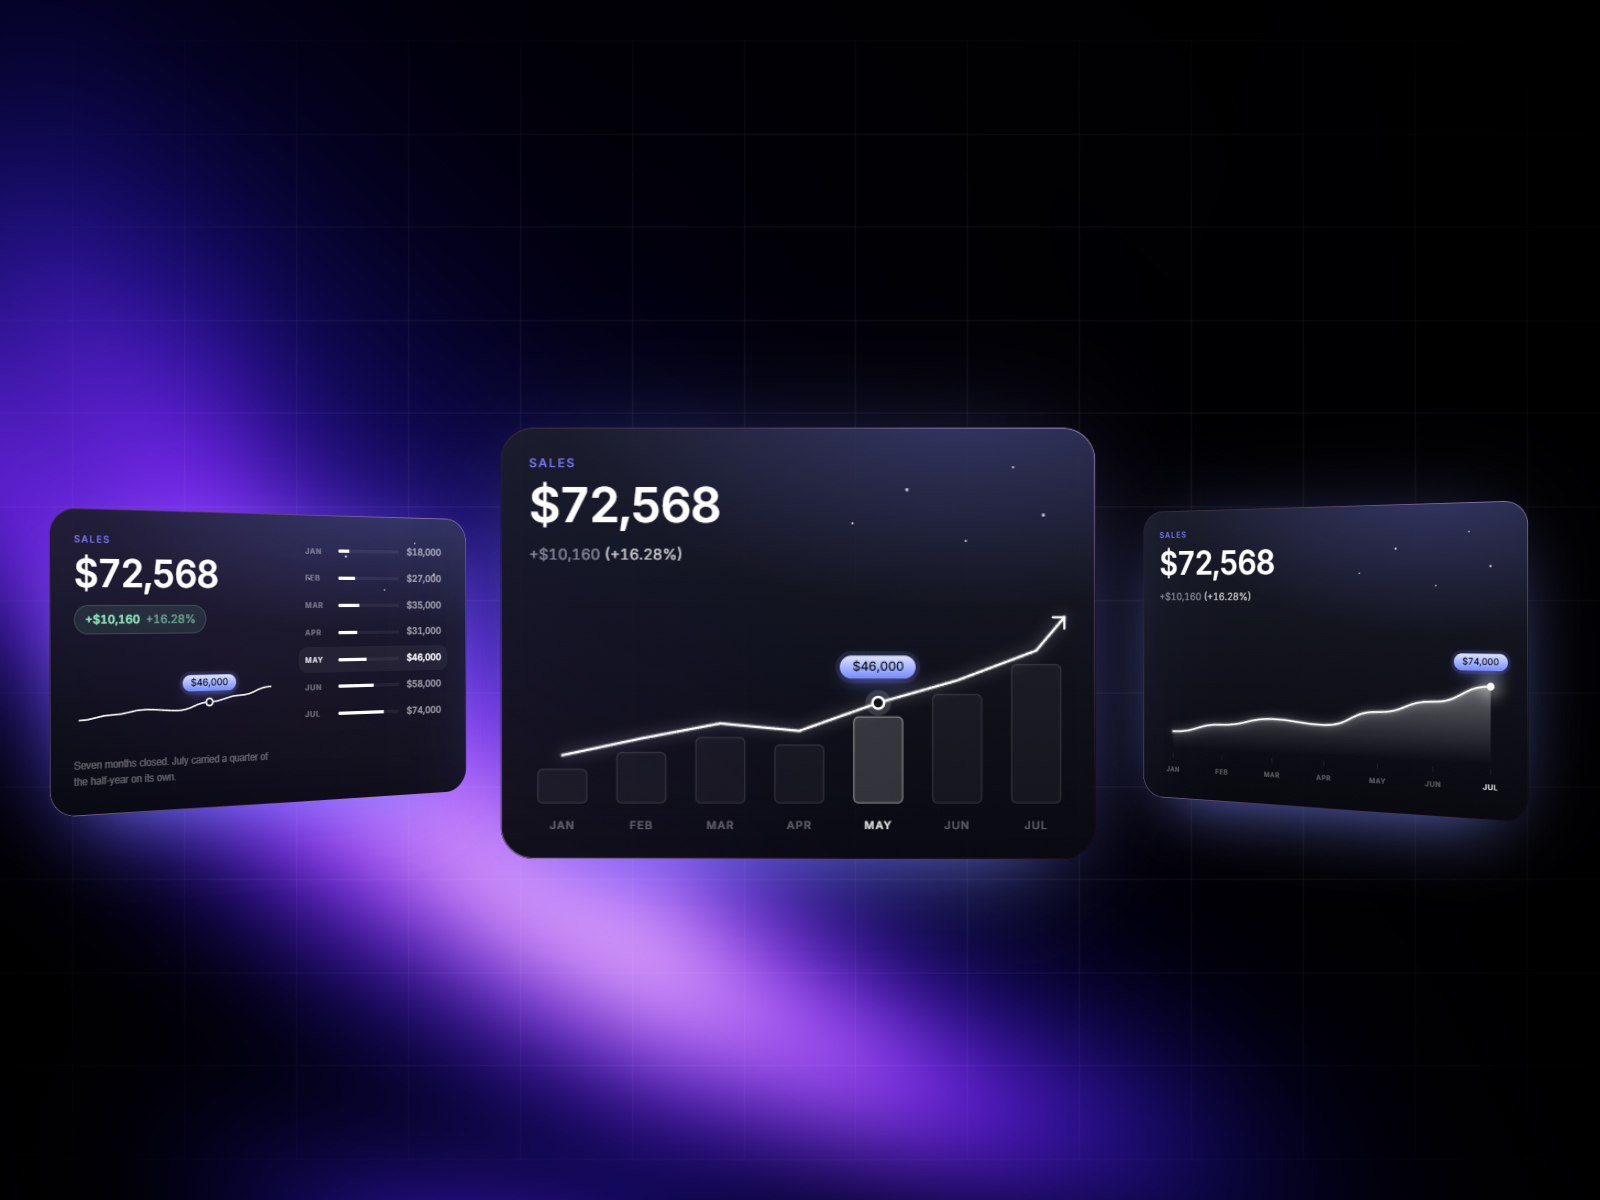
Glow Metrics is a 3-in-1 animated data visualization component for Framer.
Description
Glow Metrics Glow Metrics is a 3-in-1 animated data visualization component for Framer. It includes three complete layouts - Columns, Ledger, and Comet - inside one component, so you can present the same data in different ways without building separate charts. Perfect for SaaS websites, dashboards, fintech products, agency case studies, portfolios, reports, product launches, and landing pages. Key features: Three charts in one Switch between three distinct layouts directly in the Framer property panel. Columns Combine animated bars, a trend line, highlighted points, and an optional arrow. Visitors can drag across the chart to explore values. Ledger Pair a headline metric with a sparkline and detailed data list. Hovering over a row highlights its value and updates the indicator. Comet Display a glowing line that draws itself on entrance and follows the cursor after the animation finishes. Motion and interaction Totals count up, bars rise, lines draw, and labels appear in a staged sequence. Adjust the delay and tempo or replay the animation on scroll. Flexible controls Add custom labels and values, choose a currency prefix, control total and point multipliers, set the comparison percentage, and select a highlighted point. Customize fonts, colors, gradients, glow, rim light, pills, radius, spacing, and speed. Easy Framer setup Choose a layout, enter your data, and customize everything visually without code. Refund policy This is a digital product. All purchases are final and refunds are not available. Please review the product details before purchasing. Support Need help? Email promakdesign@gmail.com .
Introduction
Modern charts with a soft glow
Rank history
Daily rank per list, from the first snapshot — lower is better.
- All · #2898