component
Ringly
By Aprilia Gunawan
Details
- Aprilia GunawanAuthor
- componentType
- 2026-08-28Published
- 2026-08-28Updated
- 2026-08-28Added
- ChartsCategories
Summary
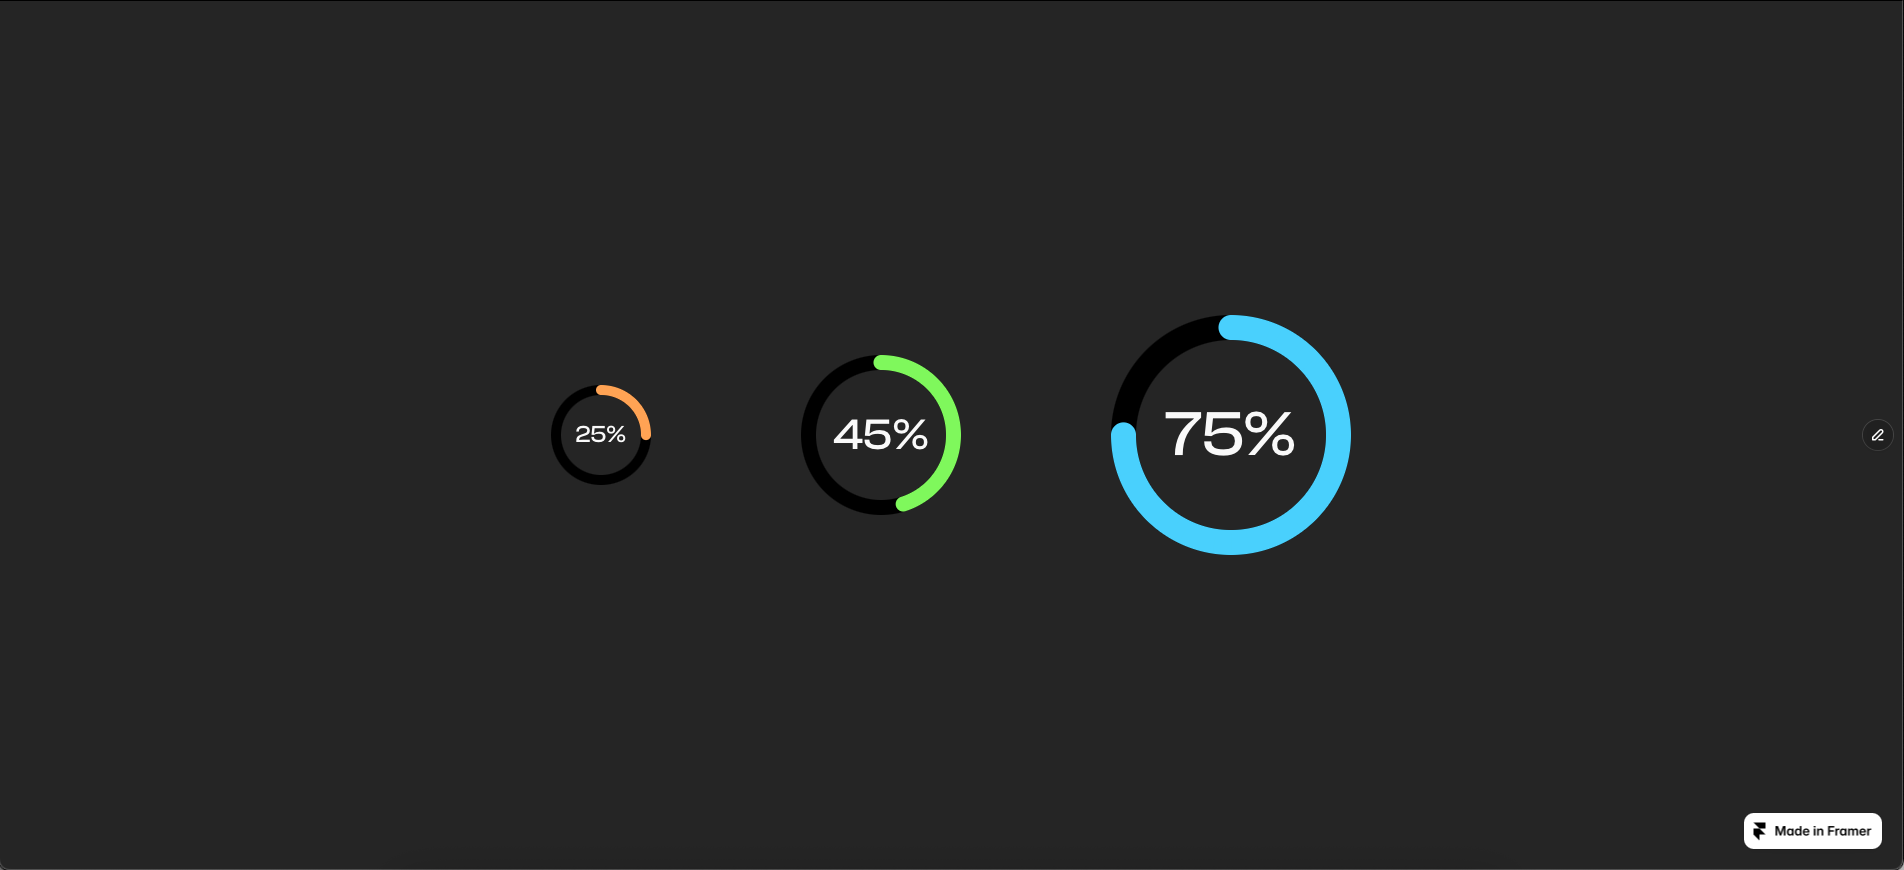
Ringly is a single-metric animated donut chart built for stats, progress indicators, and data highlights — the kind of number you want a visitor's eye to land on.
Description
Ringly is a single-metric animated donut chart built for stats, progress indicators, and data highlights — the kind of number you want a visitor's eye to land on. Set your percentage and watch it animate in on appear, with the ring sweeping and the number counting up together. Every visual detail is yours to control: base track color, progress color, number color, stroke width, and overall size, so it matches your brand instead of looking like a stock chart. Typography is fully open — pick any font already in your project and set the size directly in the component panel, no separate text layer needed. Timing is tunable too: set your animation duration and delay, choose when it triggers, and decide whether it replays every time it scrolls back into view or plays once and holds. Good for portfolio stats, service pages, dashboards, or anywhere a number deserves a little motion.
Introduction
A Donut Chart
Rank history
Daily rank per list, from the first snapshot — lower is better.
- All · #4669