component
Sales Dashboard
By Abdul Sami
Details
- Abdul SamiAuthor
- componentType
- 2026-09-05Published
- 2026-09-05Updated
- 2026-09-05Added
- CardsCategories
Summary
📊 A sales dashboard for anyone selling a small catalogue — set up entirely from the properties panel, no code to touch.
Description
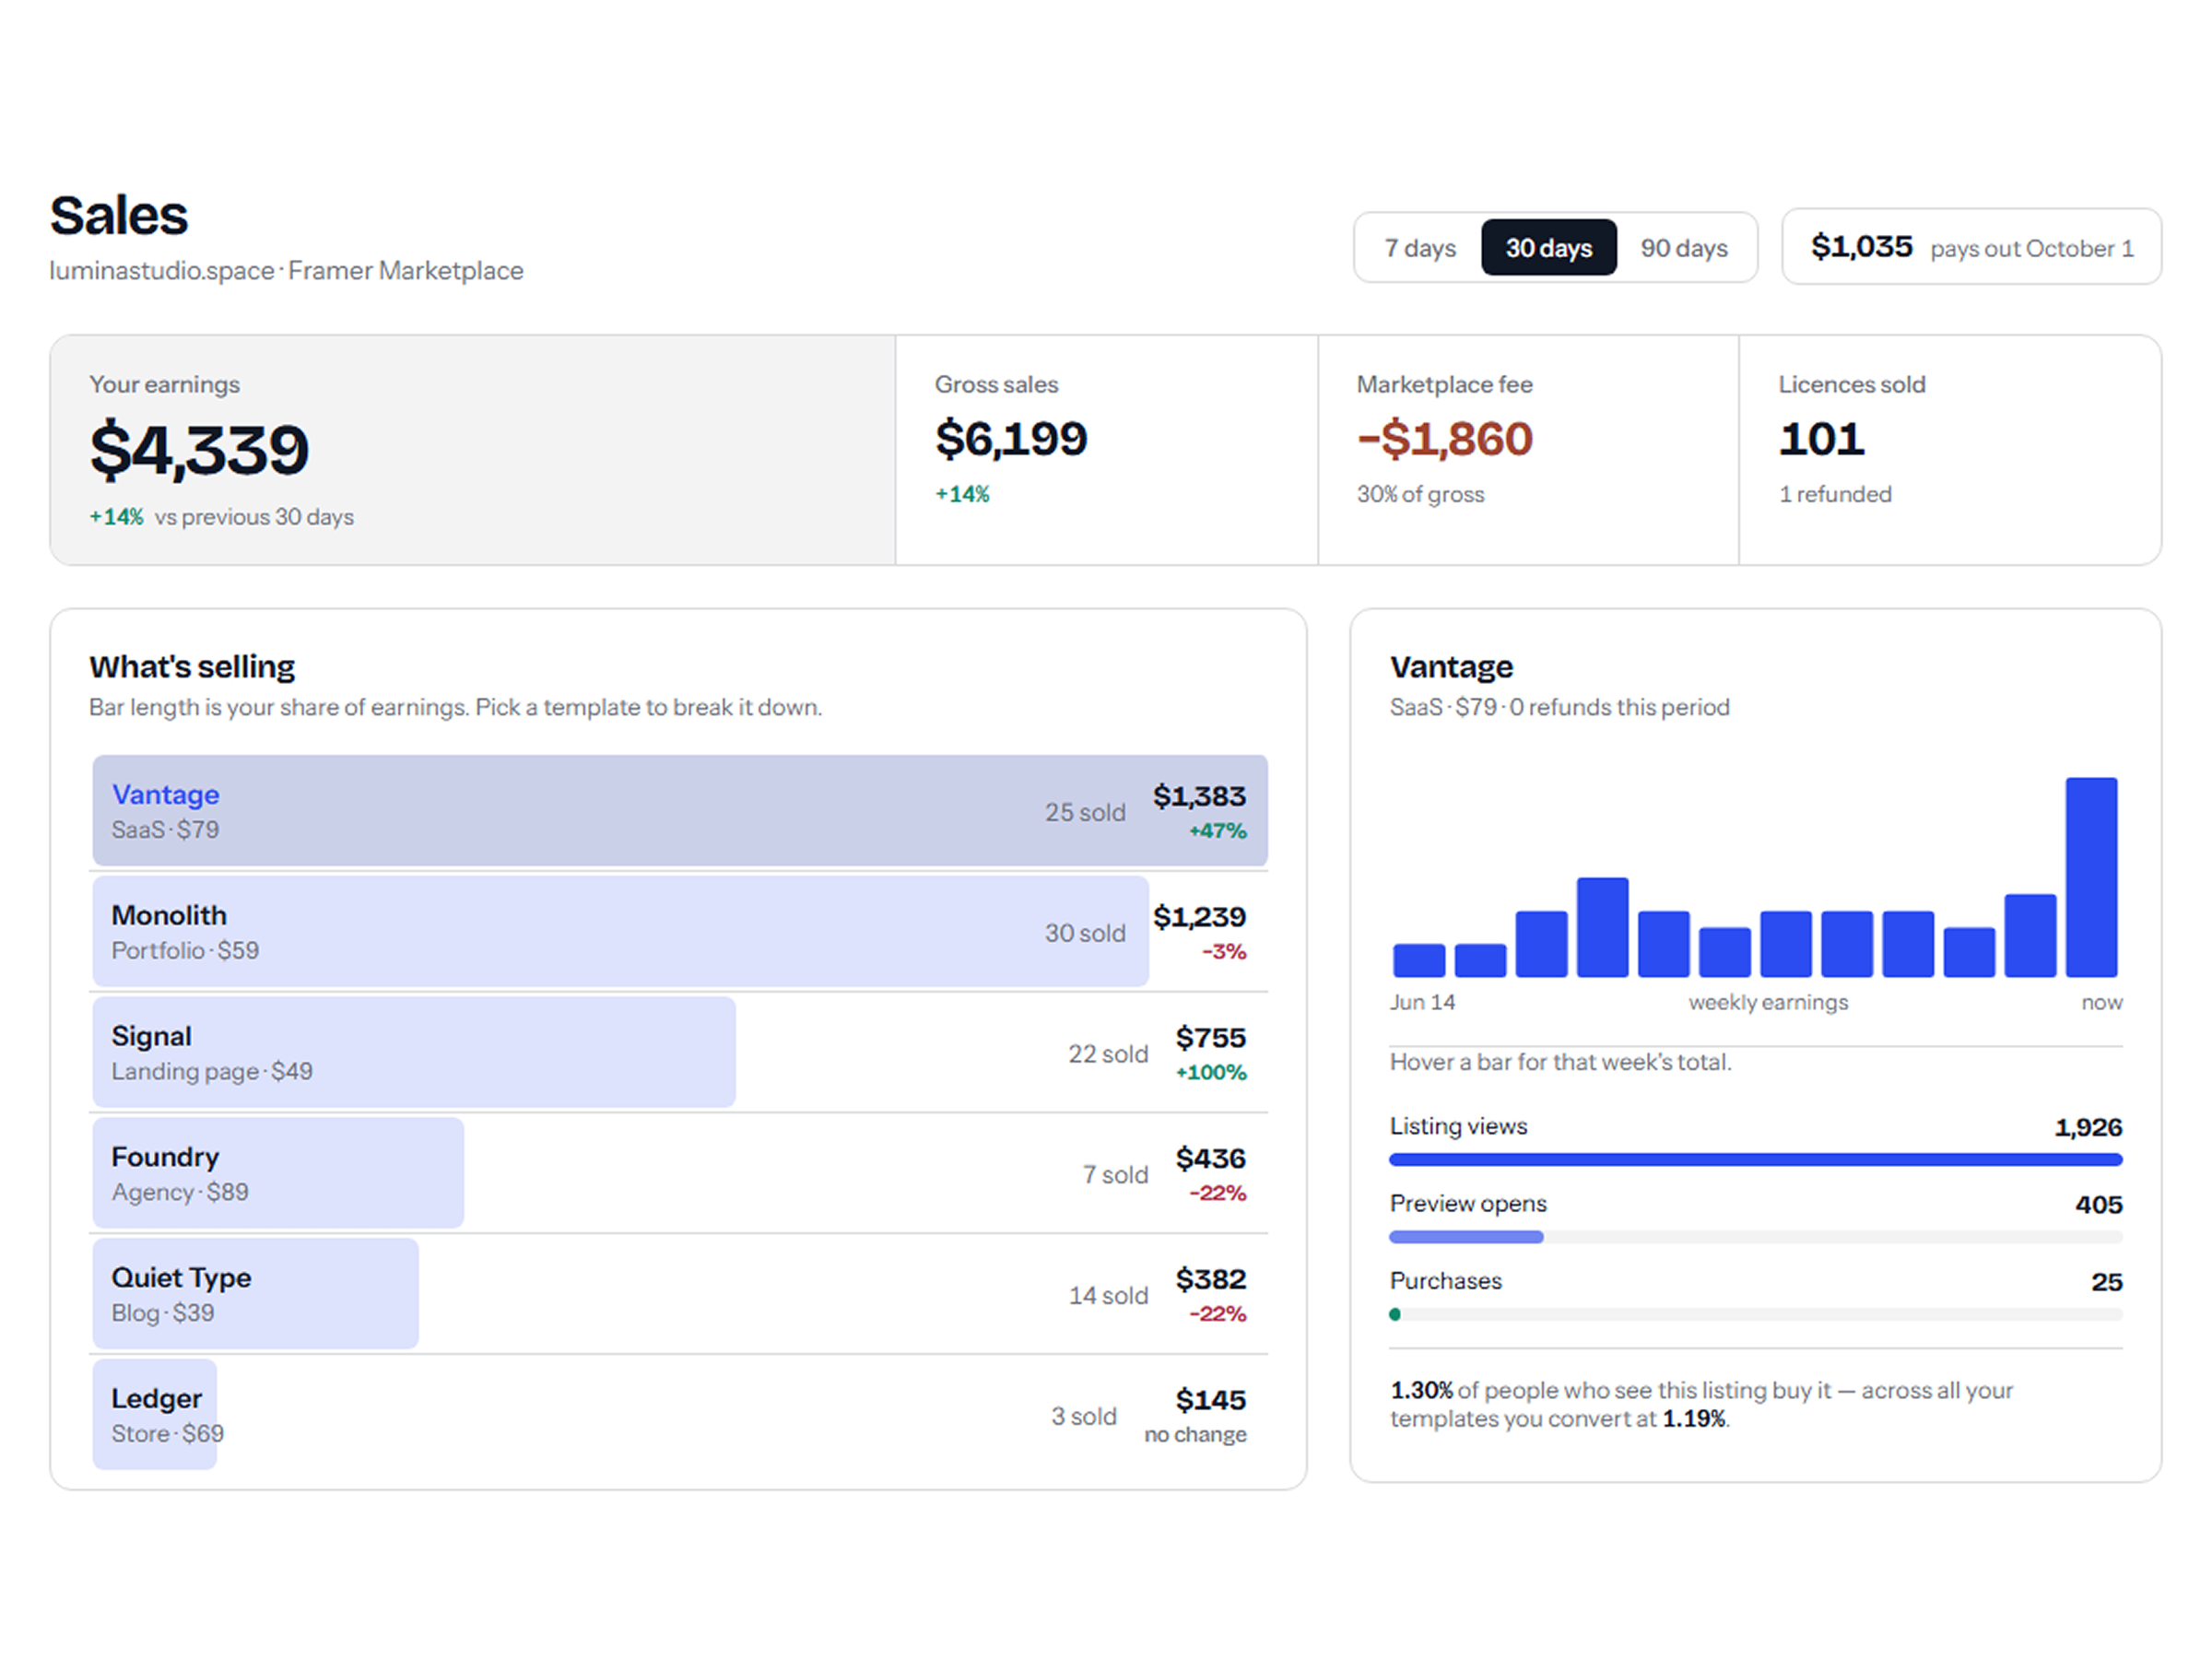
📊 A sales dashboard for anyone selling a small catalogue — set up entirely from the properties panel, no code to touch. Most dashboard components hand you a grid of identical cards. This one leads with a leaderboard where every row is its own bar, so your ranking and your chart become the same object. ⚡ What's inside - 🏆 Leaderboard rows that double as bars — click one to drill in - 📈 12-week earnings chart with hover readout - 🎯 Views → previews → purchases funnel, with conversion - 💳 Orders table and a pending payout pill - 🗓 7 / 30 / 90-day ranges that recalculate everything 🎛 Yours to shape - ✏ Add products — name, category, price, demand, trend - 🎨 Six colour controls and radius; borders derive from them - 🔀 Toggle the payout, funnel and orders sections - 💱 Six currencies, adjustable fee 📱 Responsive, keyboard-navigable, reduced-motion aware. Animation runs in Preview only — never on your canvas. ℹ Figures come from the values you set, not live sales data.
Introduction
See what earns, not just sells
Rank history
Daily rank per list, from the first snapshot — lower is better.
- All · #2144