component
Sales Overview
By Ahmet Loca
Details
- Ahmet LocaAuthor
- componentType
- $6.00Price
- 2026-08-27Published
- 2026-08-31Updated
- 2026-08-27Added
- ButtonsCategories
Summary
Sales Overview is a Framer analytics component for dashboards, SaaS pages, and finance sections.
Description
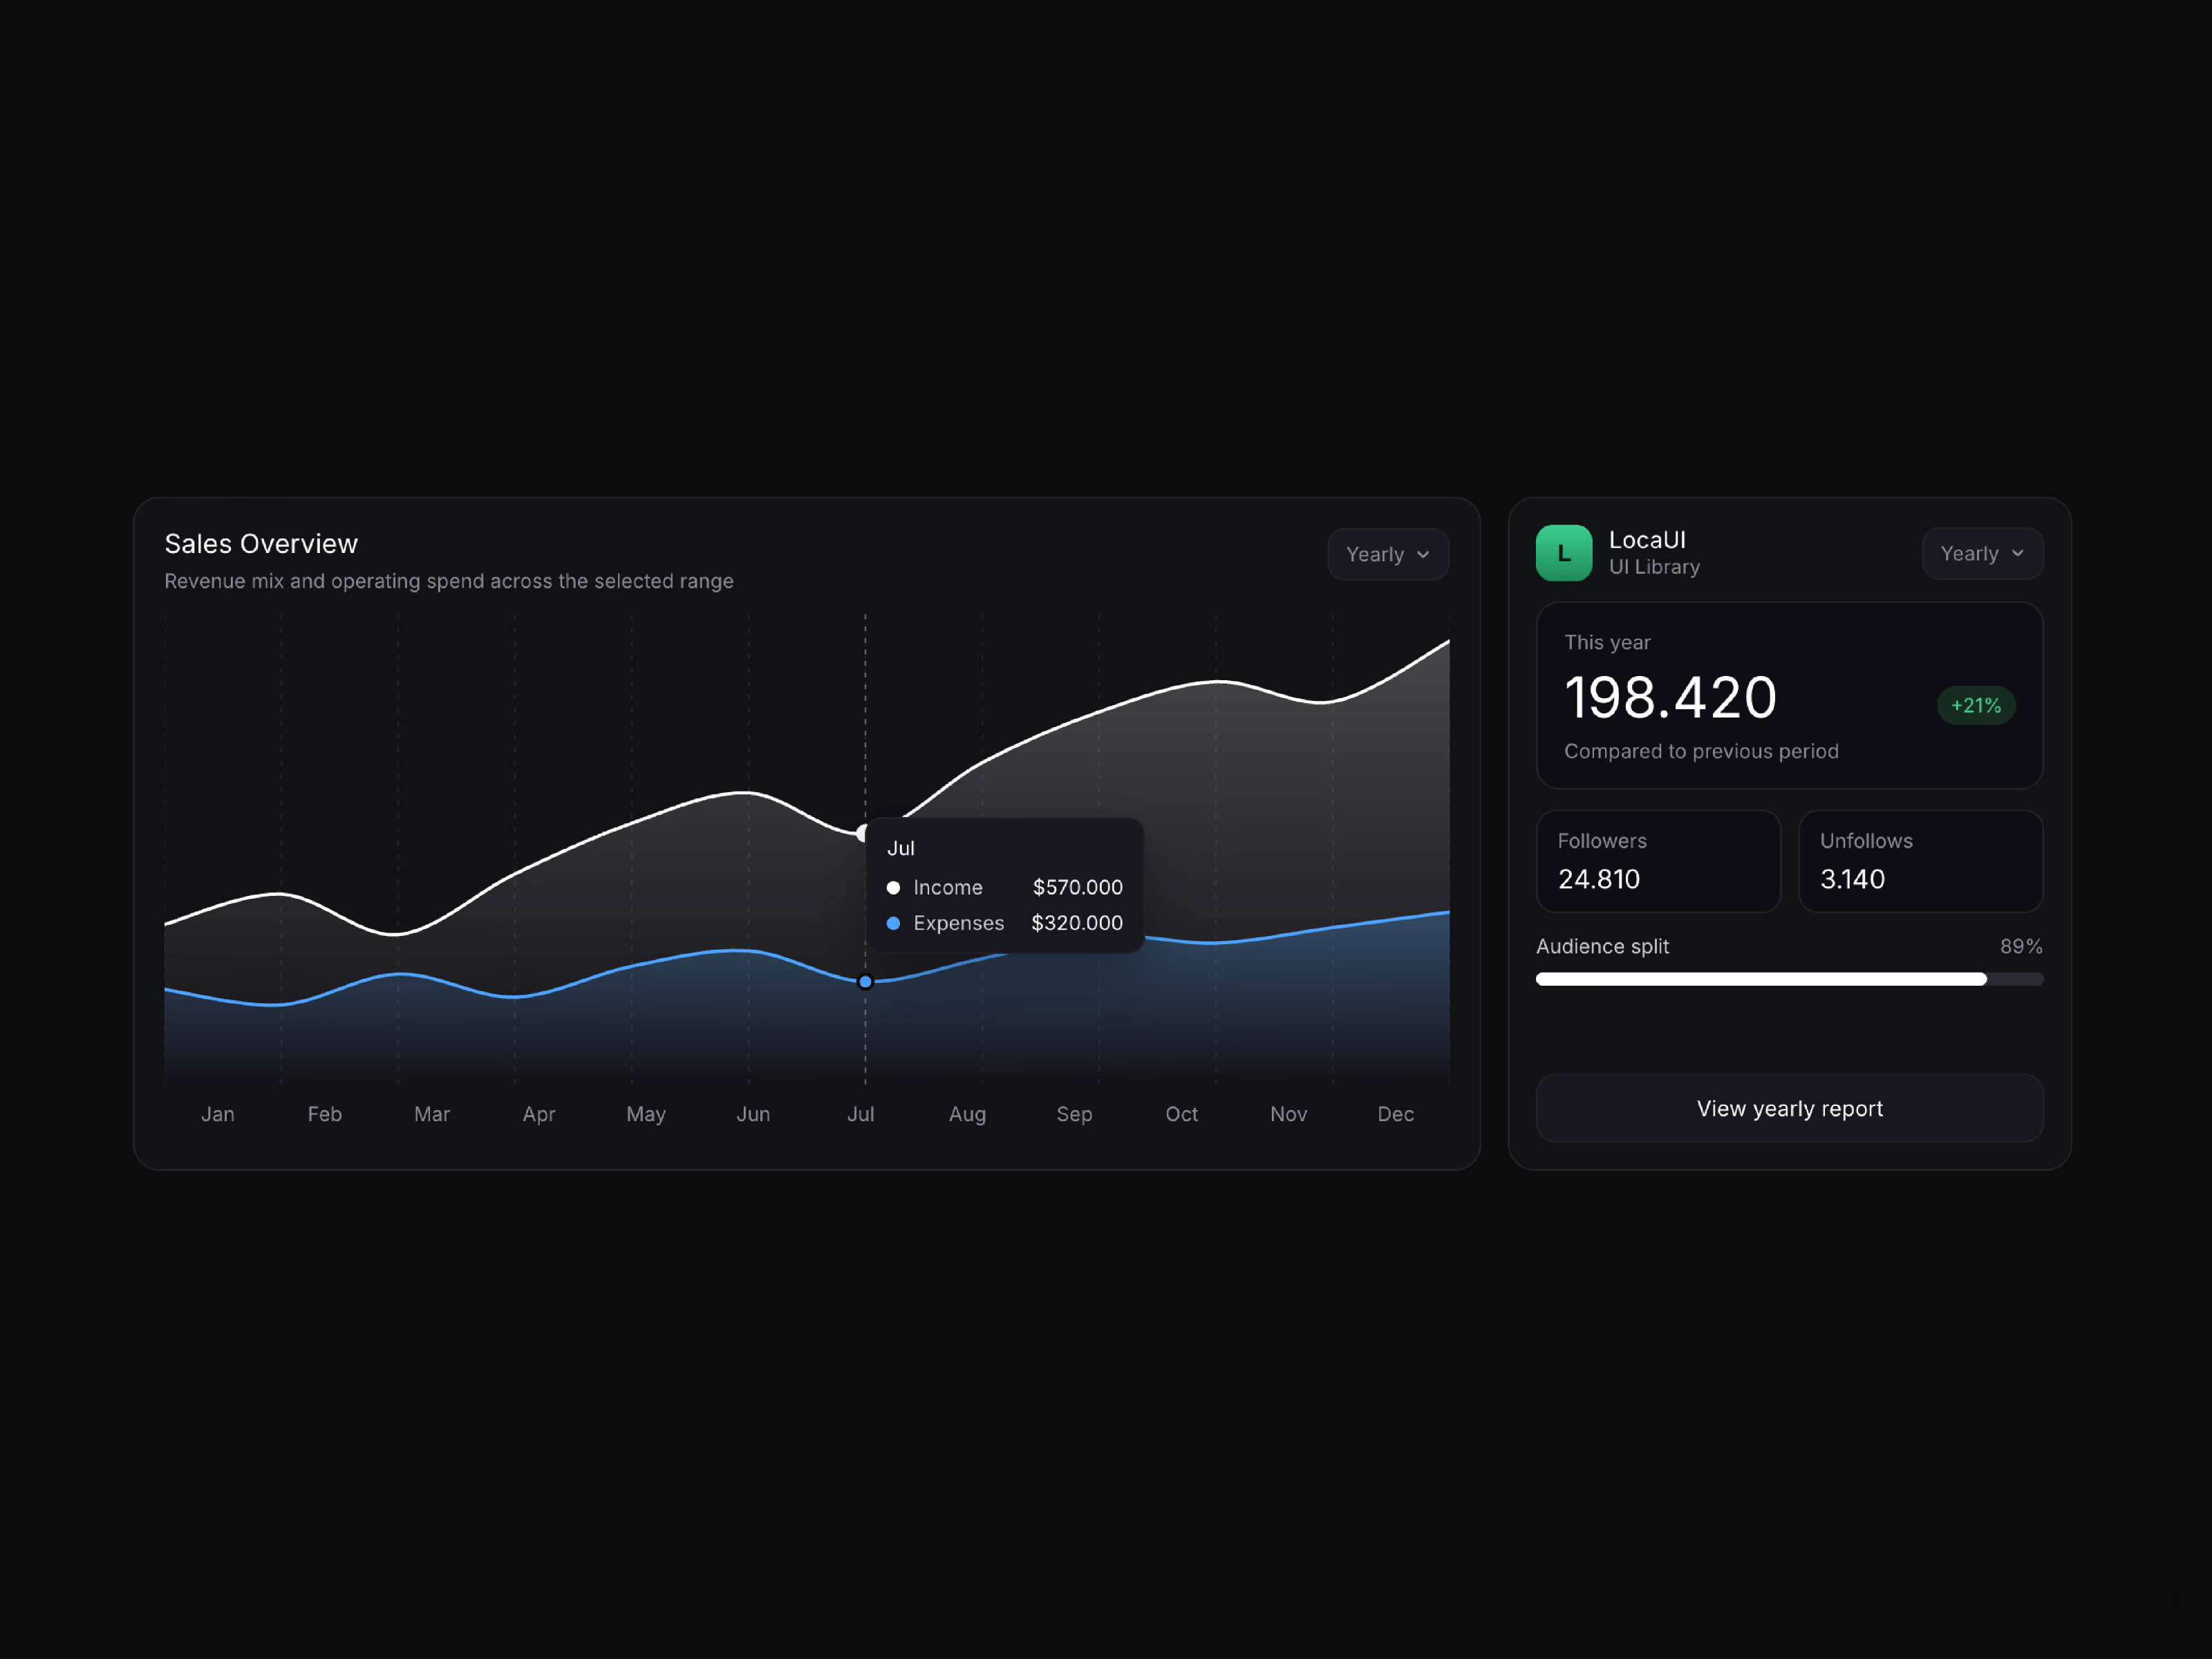
MORE FRAMER COMPONENTS LIKE THIS ✦ Browse +38 FREE + 85 premium components: https://frameze.com/components About Sales Overview Sales Overview is a Framer analytics component for dashboards, SaaS pages, and finance sections. A dual-line chart compares income and expenses while a LocaUI KPI card shows period value, change, followers, and audience split. Switch Yearly or Weekly to load separate data, labels, and button text. • Separate Yearly (12 months) and Weekly (Mon–Sun) datasets • Synced range menus on both cards • LocaUI brand card with hero value and change badge • Followers / unfollows chips and audience progress bar • Period-specific CTA: yearly report vs weekly breakdown • Native Framer font pickers for title, value, labels, button, tooltip • Grouped controls: Labels, Yearly Data, Weekly Data, Fonts, Theme • Static-renderer safe — no canvas animation loops • Stacks vertically below a custom breakpoint • Works out of the box — edit numbers and publish Use Cases SaaS dashboards and admin product pages Ecommerce revenue and spend summaries Fintech and billing overview sections Startup traction and KPI landing blocks Investor updates and pitch-site metrics Agency case studies with period compare Internal ops scorecards in Framer Marketing reports with income vs expenses Audience growth and unfollow tracking Portfolio sites for product designers Keywords sales overview framer, income expenses chart, dual line chart, yearly weekly toggle, kpi card framer, locaui analytics, audience split bar, followers unfollow stats, hover tooltip chart, dashboard component, saas metrics section, finance overview ui, responsive analytics card
Introduction
Sales and audience analytics cards
Rank history
Daily rank per list, from the first snapshot — lower is better.
- All · #561