Pavel Golichenko
FramerKit
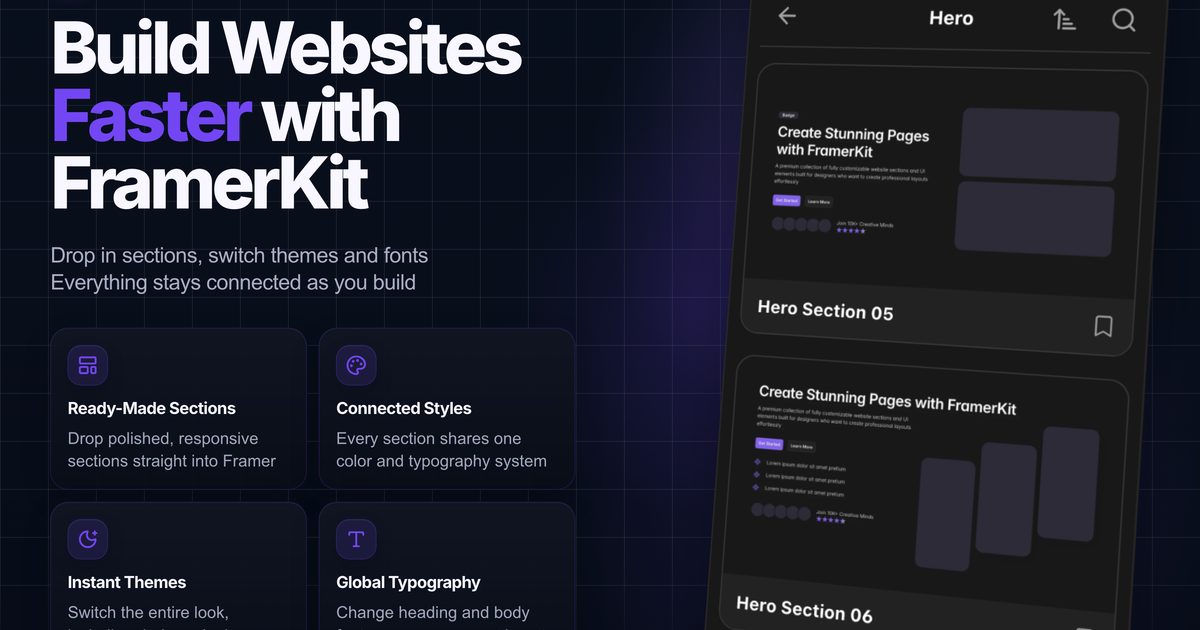
FreeBuild Websites Faster with FramerKit Everything you need to build websites in Framer.
Searching…
Telling real stories with real
Telling real stories with real
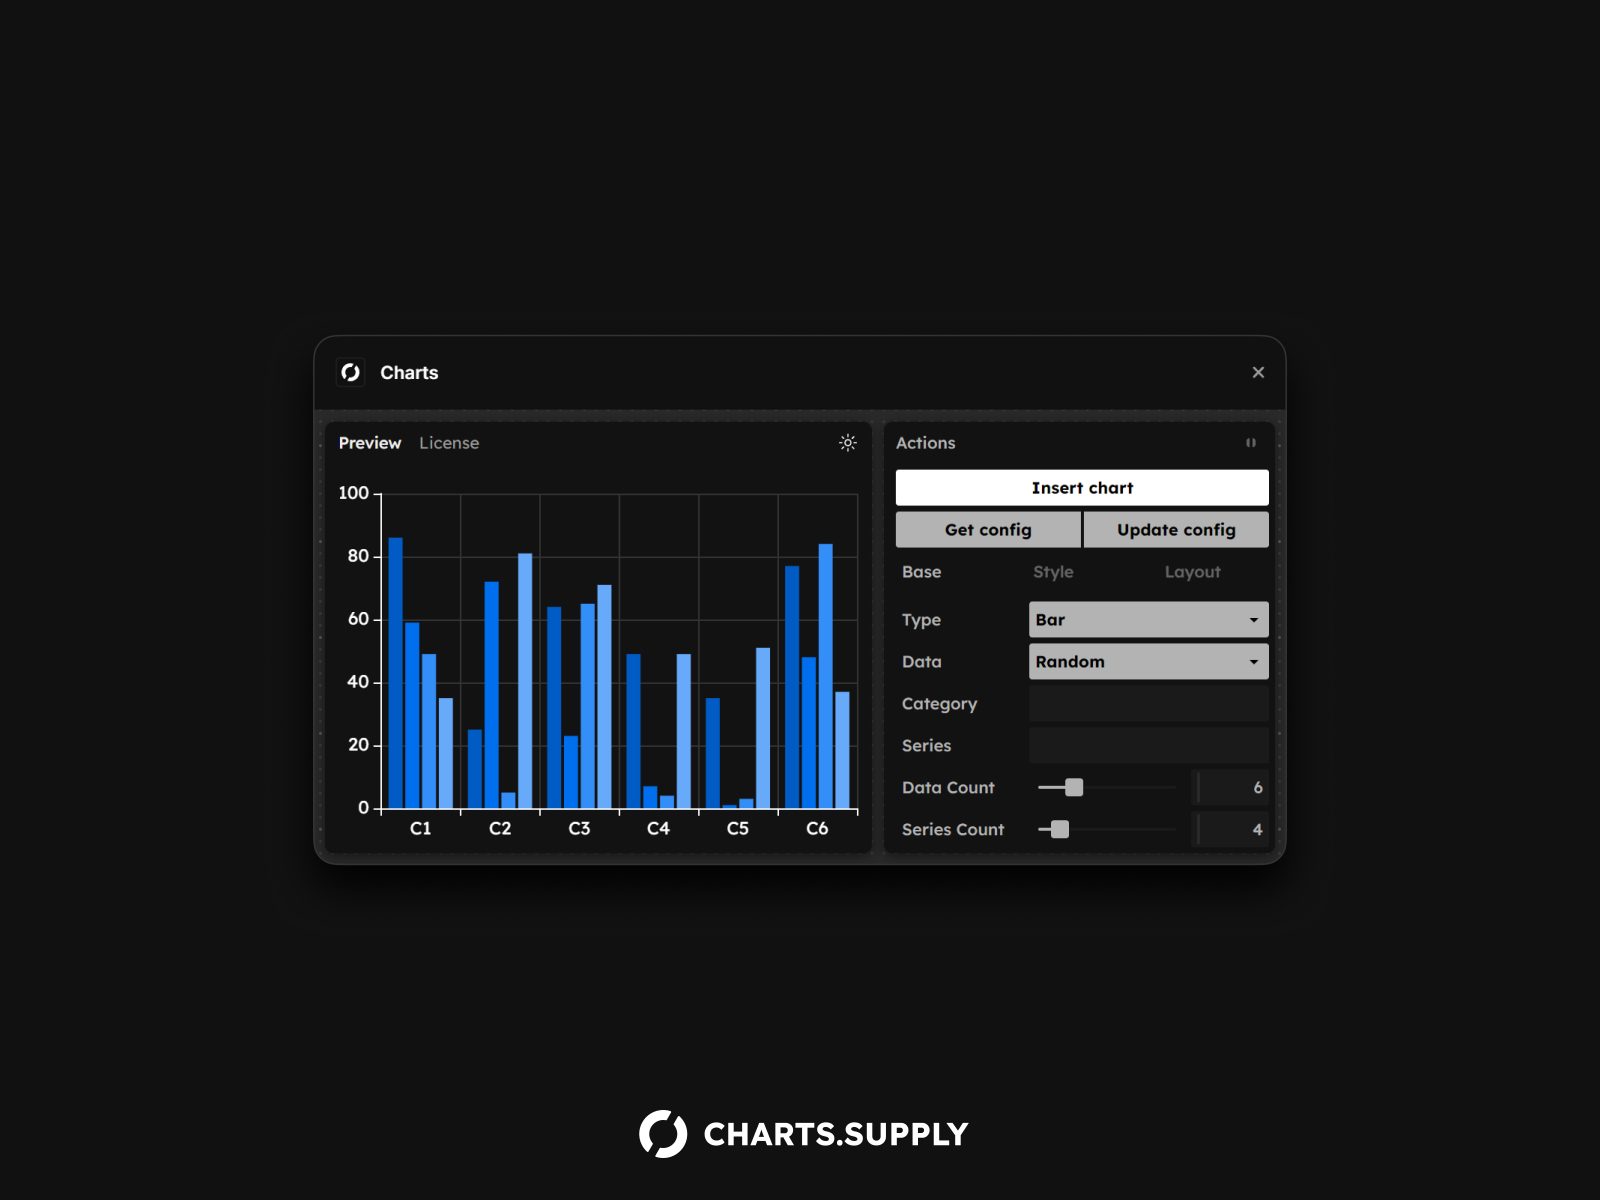
This Framer plugin helps you build data-driven charts. It seamlessly integrates with Google Sheets and databases, allowing you to tell compelling stories with real data.
Google Sheets
To integrate data from Google Sheets, First publish your prepared spreadsheet to the web, select the CSV format, and paste the URL into the plugin's API input field.
Databases
This plugin supports any database as long as the API returns a standard array of objects.
Middleware
To maximize data security and flexibility in data presentation, it is recommended to use middleware to relay the data. We recommend using Cloudflare Workers. It has a powerful free plan and the capability of integrating with various databases.
Free
Supports only Bar and Pie charts.
Pro
Supports all 8 types: Bar, Line, Mixed, Scatter, Pie, Radar, Candlestick, and Heatmap.
Get future updates for free.
Single-user license.
Team
Includes all features of the Pro plan.
Up to 5 licenses.
Enterprise
Includes all features of the Pro plan.
Up to 15 licenses.
If you have any problems or encounter any issues, please email us at [email protected]
Pavel Golichenko
Build Websites Faster with FramerKit Everything you need to build websites in Framer.
PlumSpace
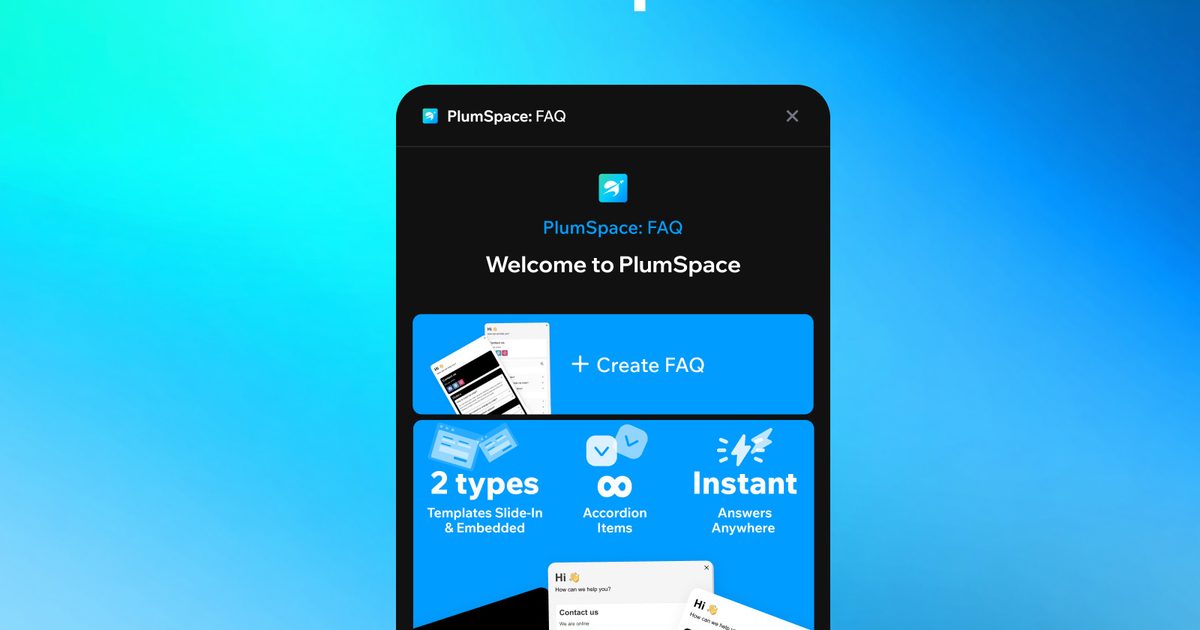
Accordion FAQ Page for Help Center

Andrei Gheorghiu
Add home exercise video demos
Abdullah Noman
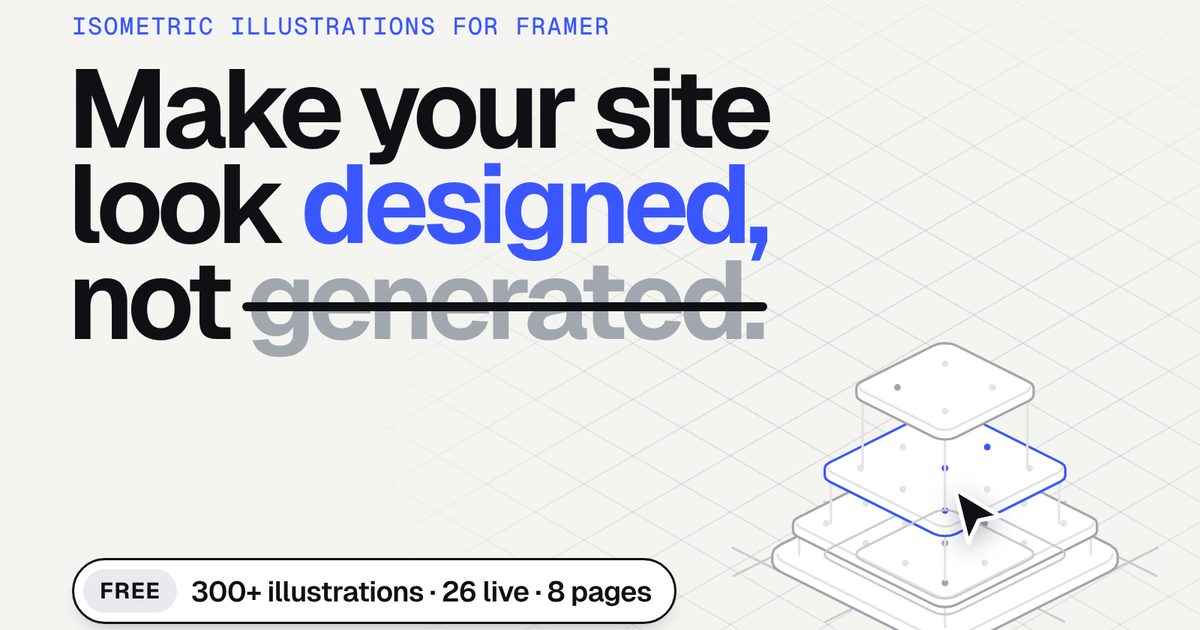
2,600+ isometric illustrations