Karim Saif
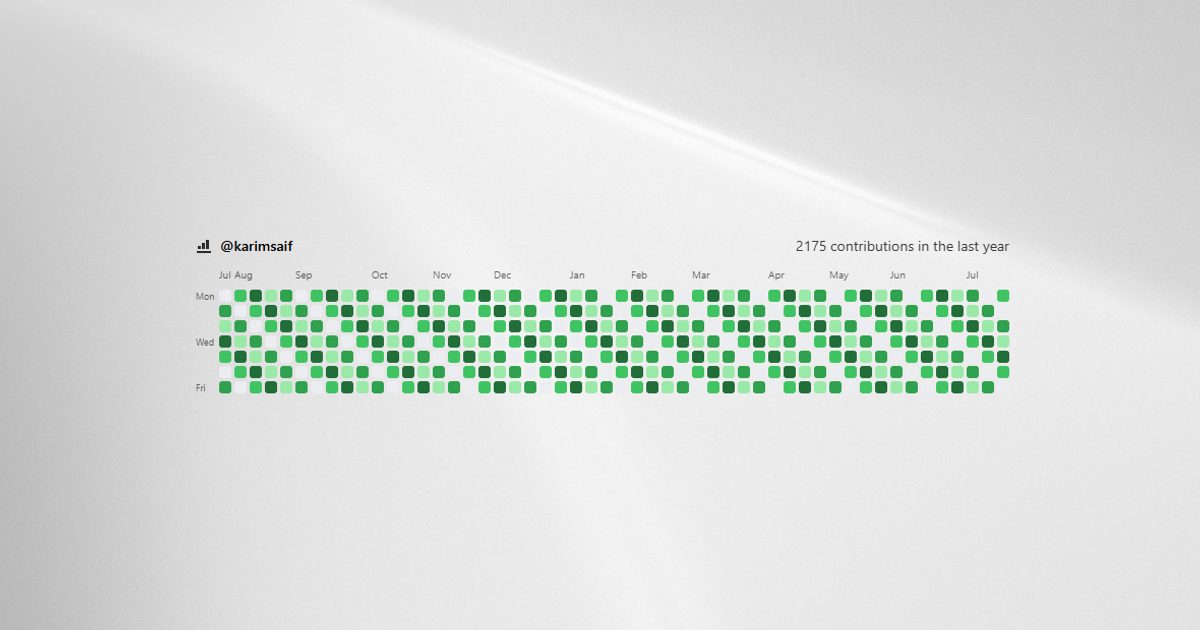
GitHub Contribution
$7GitHub Contribution Calendar for Framer A highly customizable, production-ready React component designed specifically for Framer.
Searching…
Resources
Reusable UI pieces you can drop straight into a project — browse by category, or order by rank, newest, and gaining.
Karim Saif
GitHub Contribution Calendar for Framer A highly customizable, production-ready React component designed specifically for Framer.
Shouvik Biswas
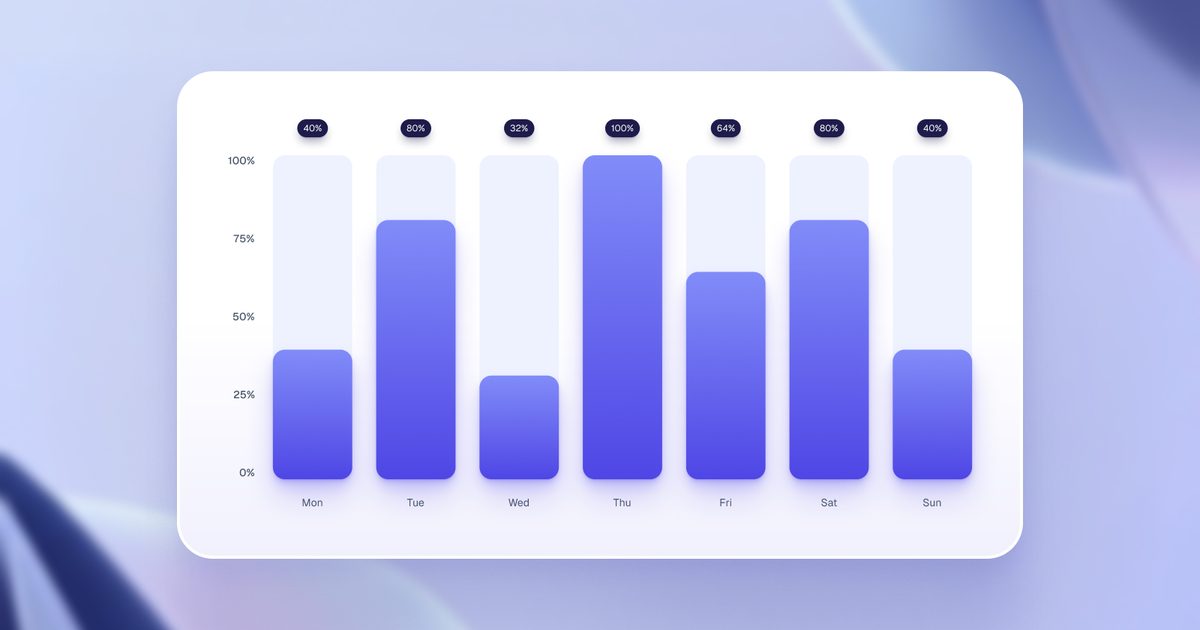
Fluid Spring-Animated Data Grid
Sajjadul Kibria
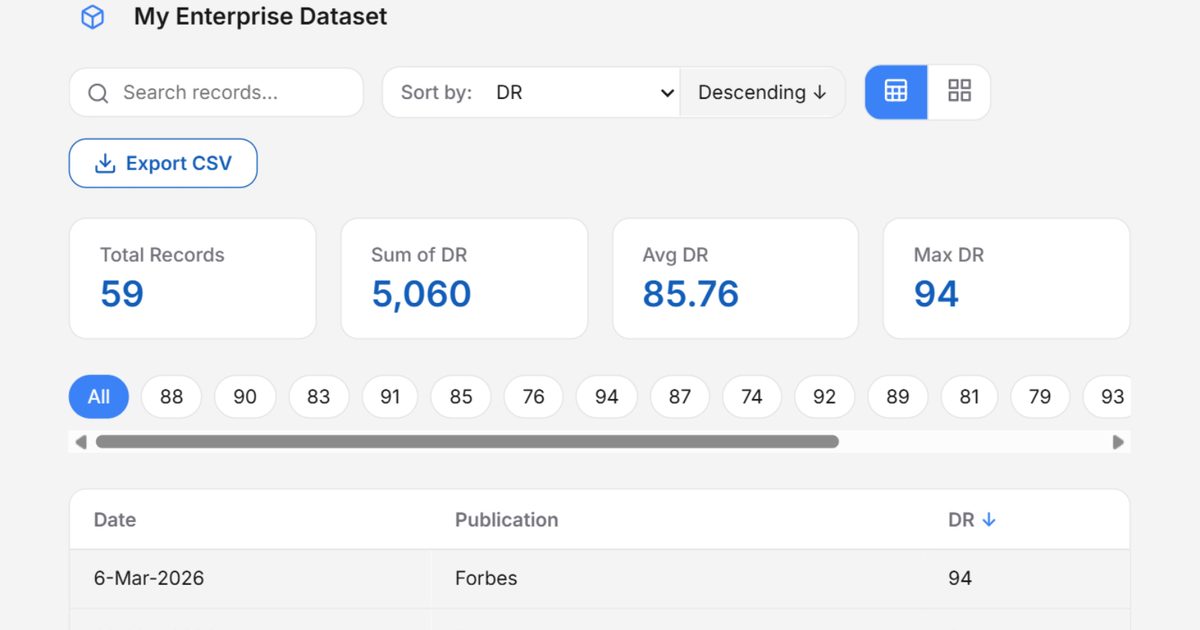
Data Visualise Pro transforms any CSV or Excel file into a polished, interactive data dashboard with zero configuration required.
Savva Sicevs
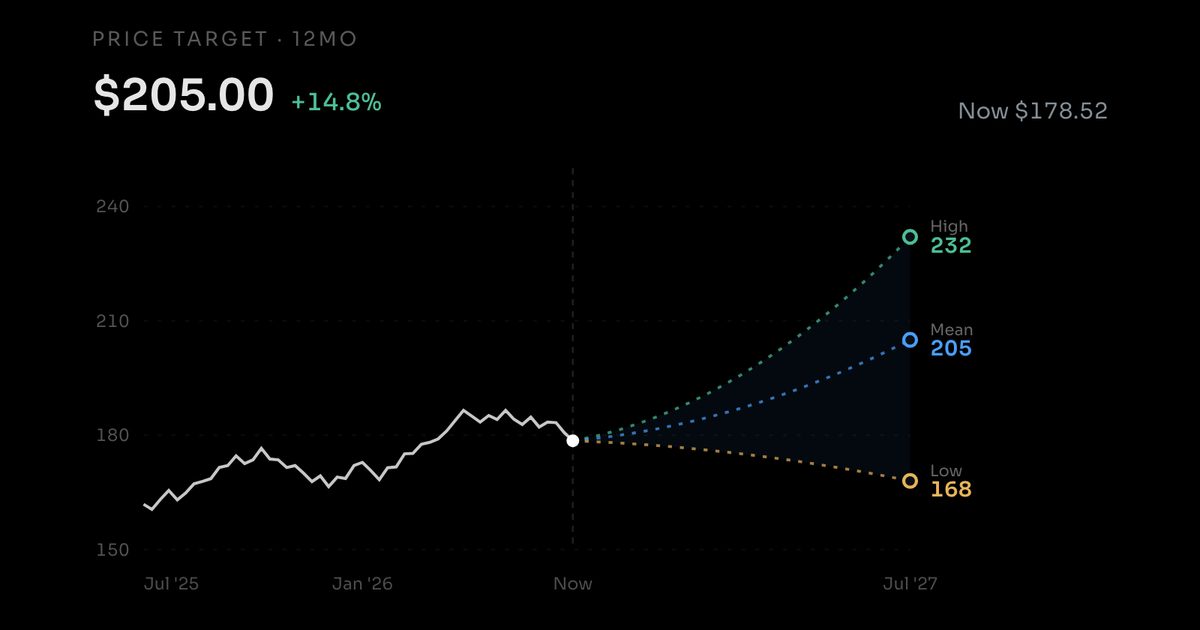
Analyst targets as a fan chart
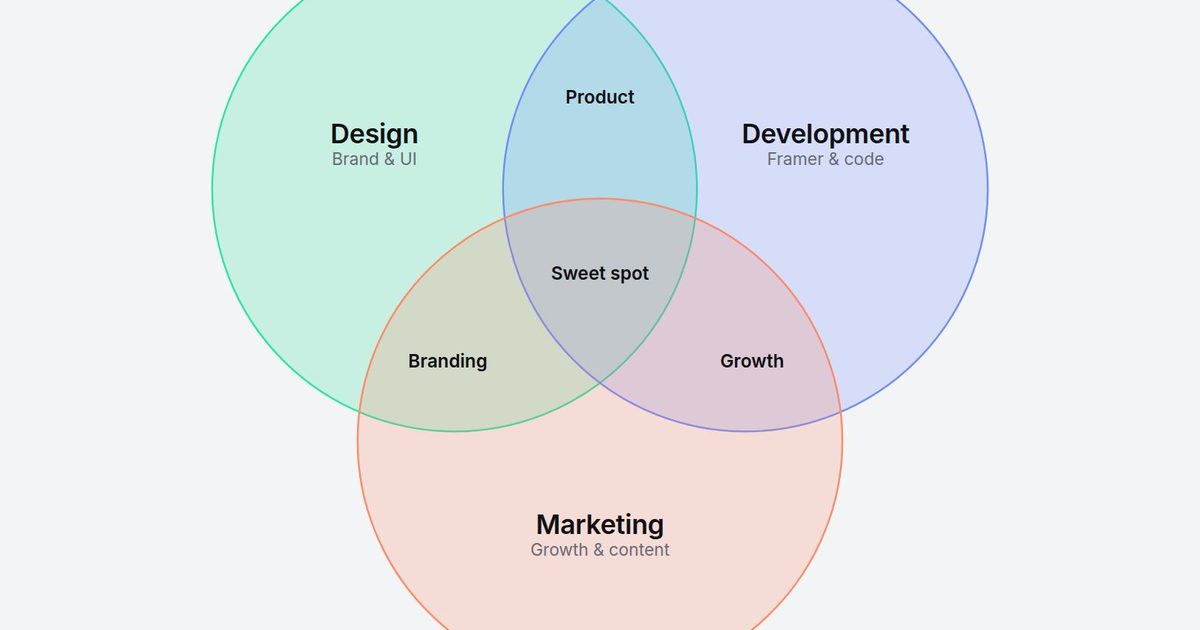
BrandingUp
Interactive 2 & 3 circle overlaps
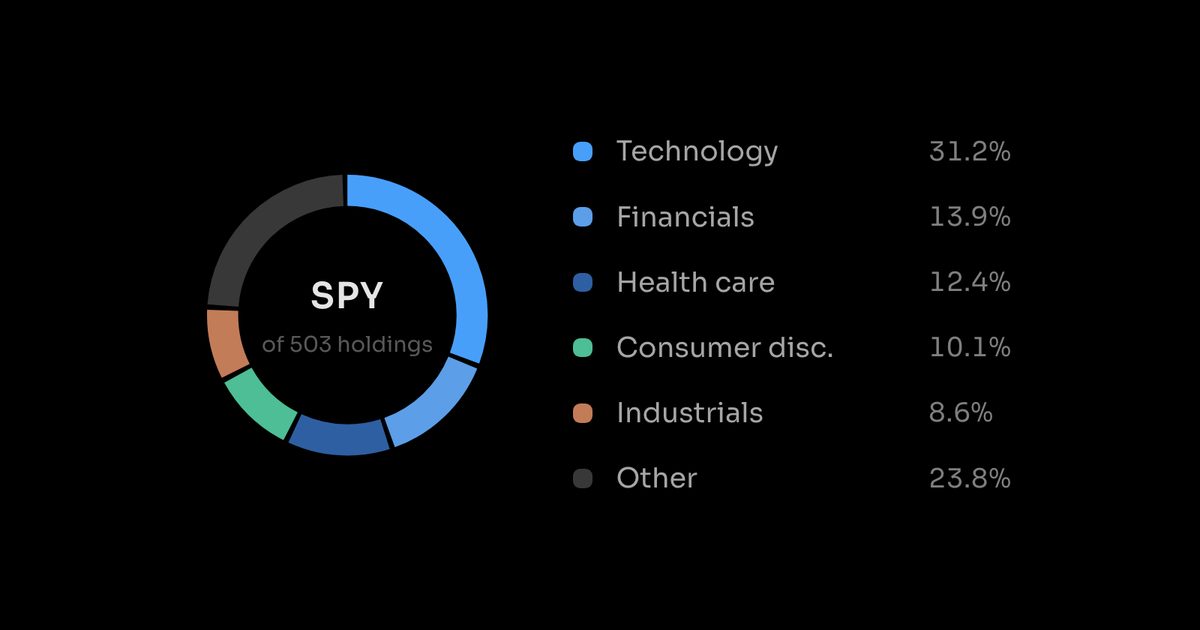
Savva Sicevs
Allocation ring with hover isolate
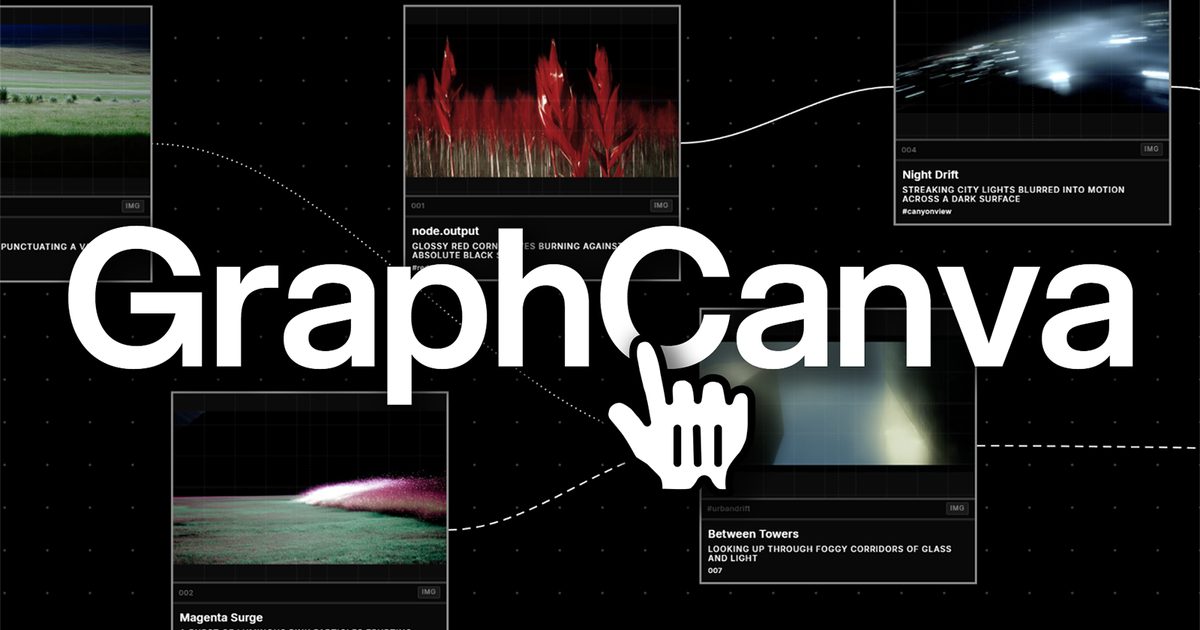
Tommaso Sala
GraphCanvas A self-contained interactive canvas for Framer.
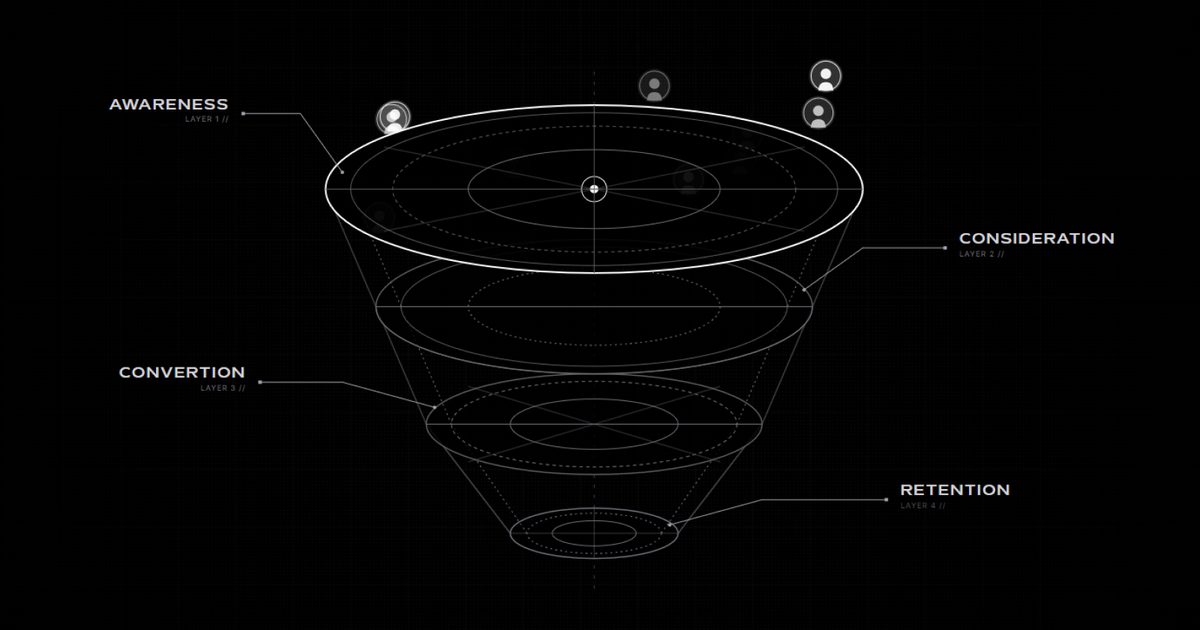
Akshay M
Visualize customer journeys with Conversion funnel — a futuristic animated funnel component built for Framer.
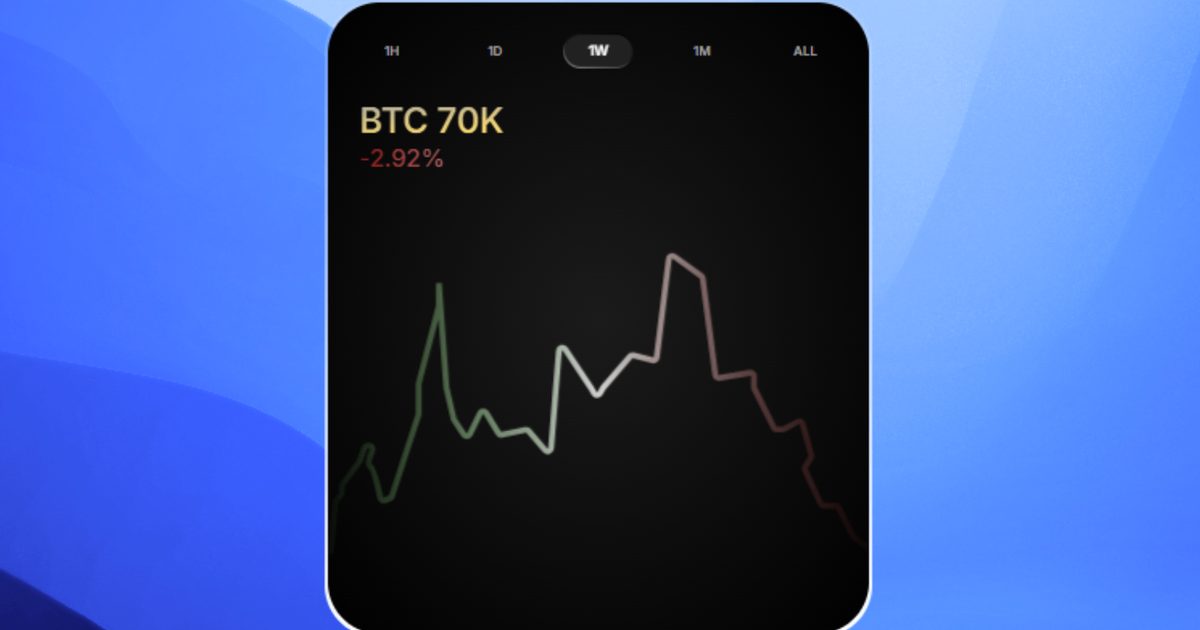
Hamim Reza
Animated finance chart with data
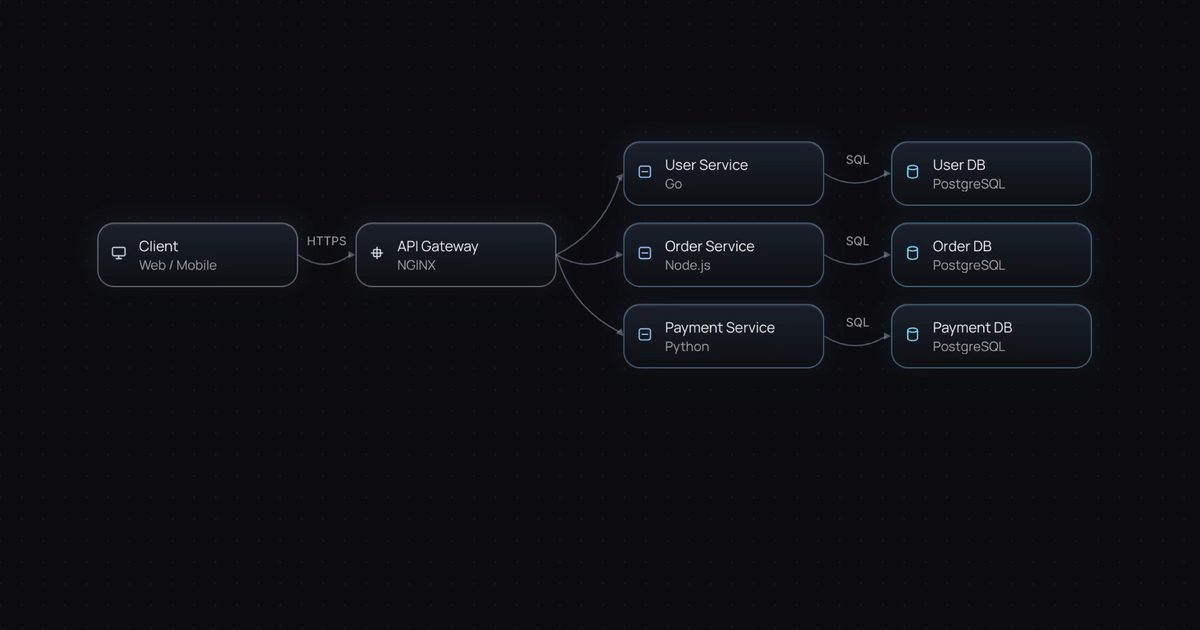
Ahmet Loca
Diagram Flow 03 DiagramFlow 03 is an animated architecture diagram component.
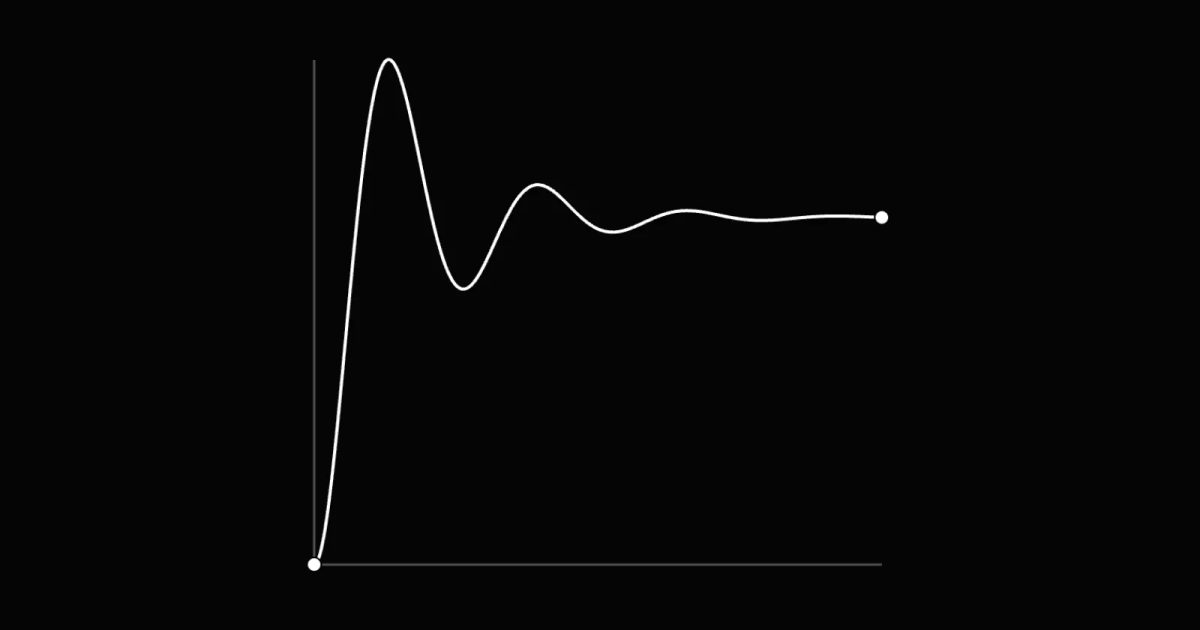
Anton Proshkuratov
Visualizer of the Transtion
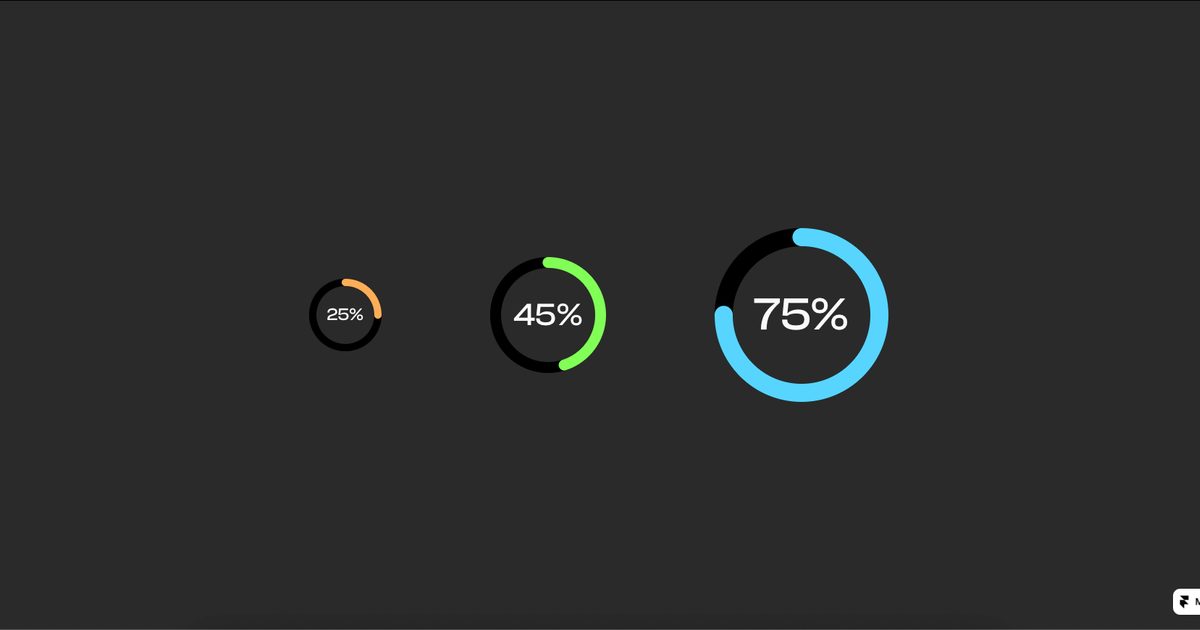
Aprilia Gunawan
Ringly is a single-metric animated donut chart built for stats, progress indicators, and data highlights — the kind of number you want…
Agung M
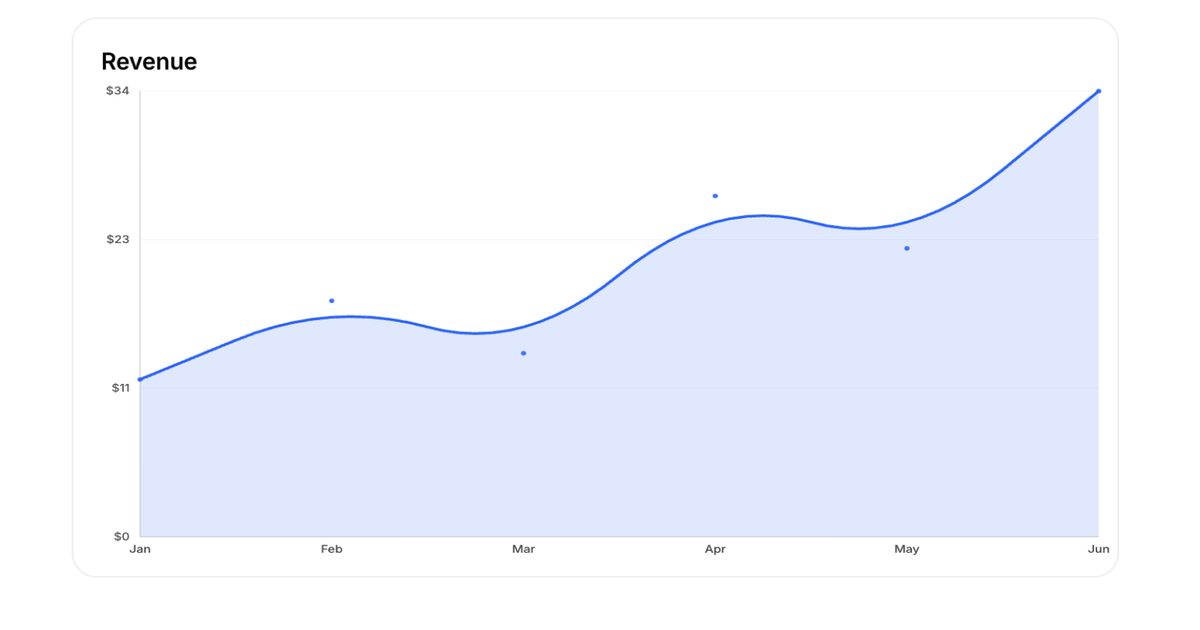
The Interactive SaaS Chart Kit brings your data to life with fluid animations and a polished aesthetic.
日香理 / hikari
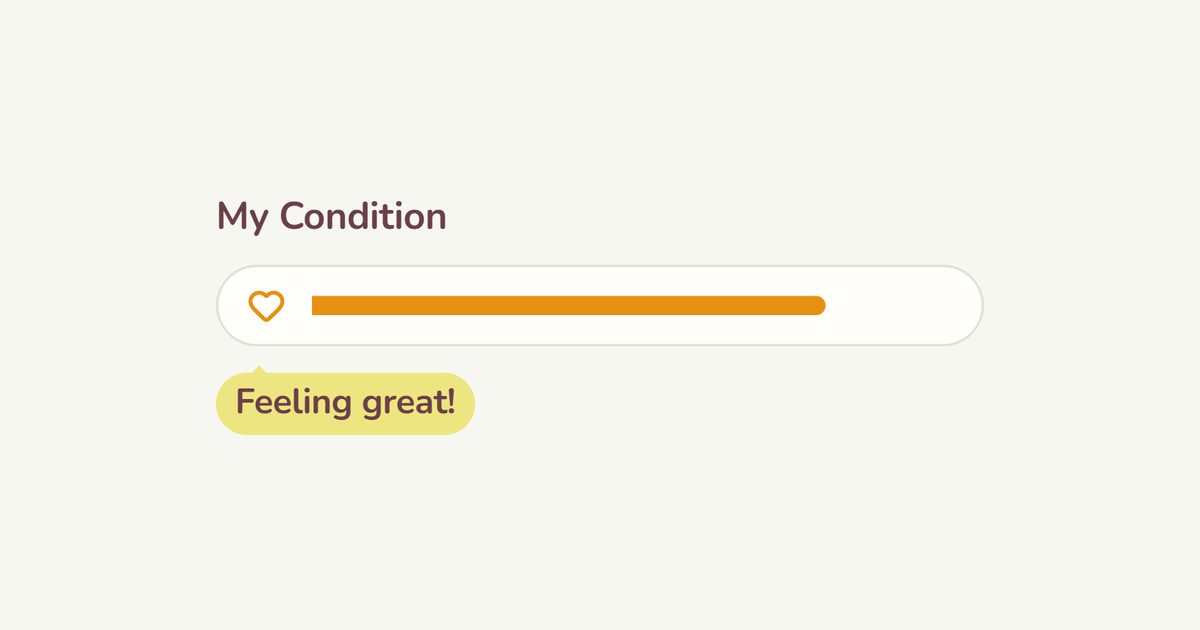
Show how you feel, game-style
Marcin Glab
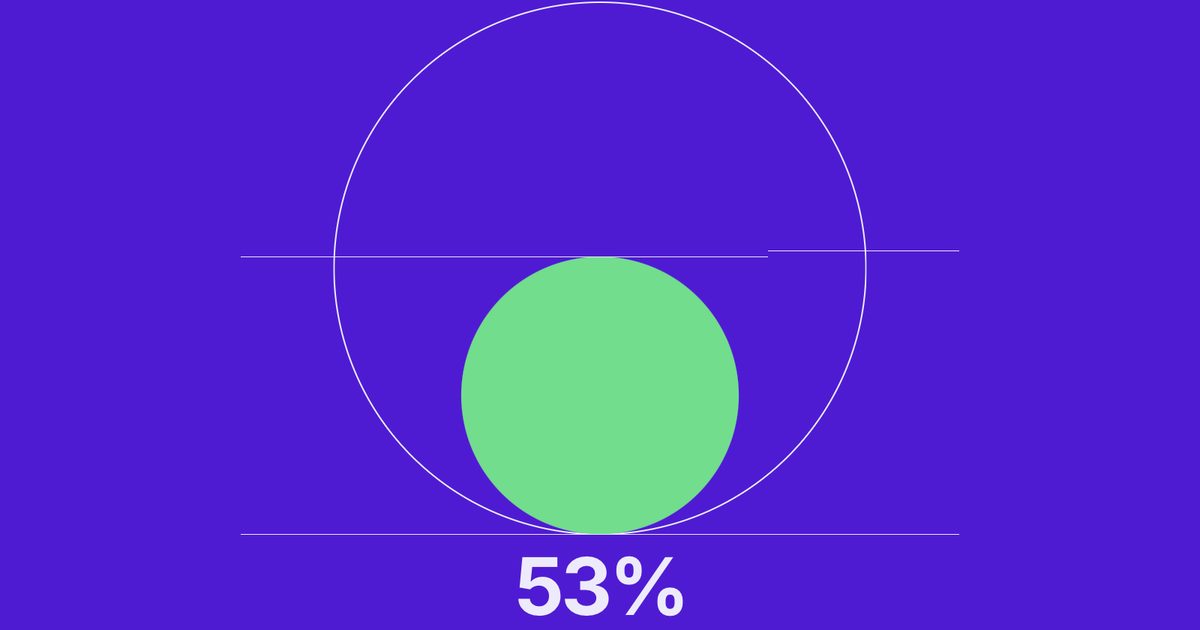
Fully customisable circular graph: Value Strokes Fill color Text style or custom font for value Animation toggle Animation parameters
Lucian
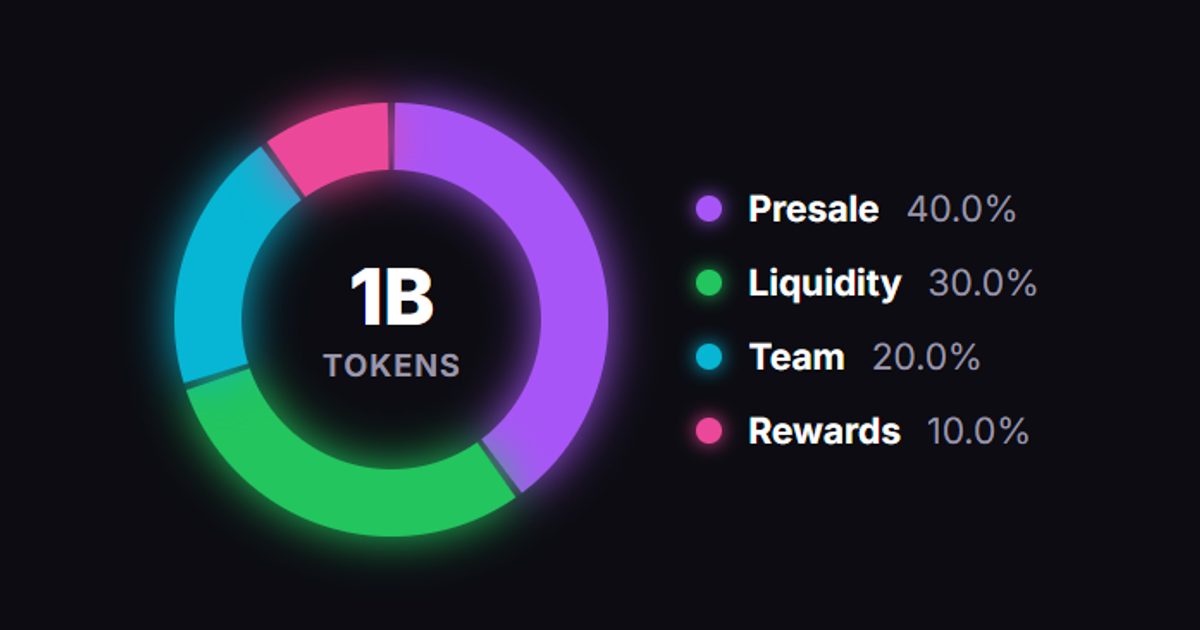
Animated, interactive donut chart
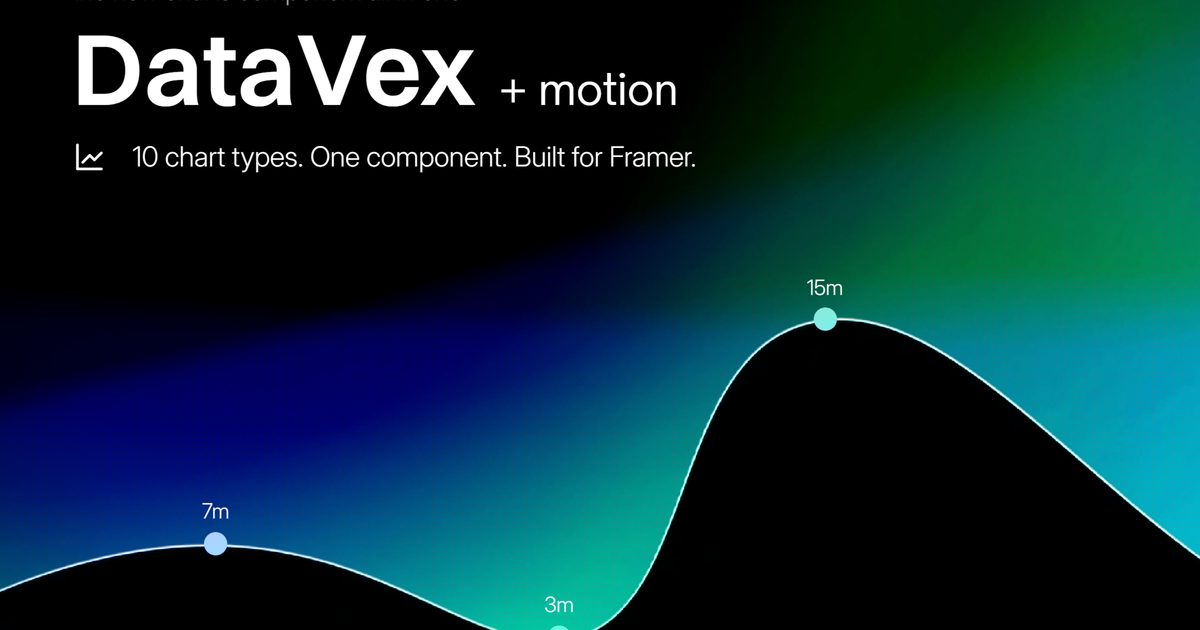
Quzmo Studios ™
Powerful interactive Framer charts
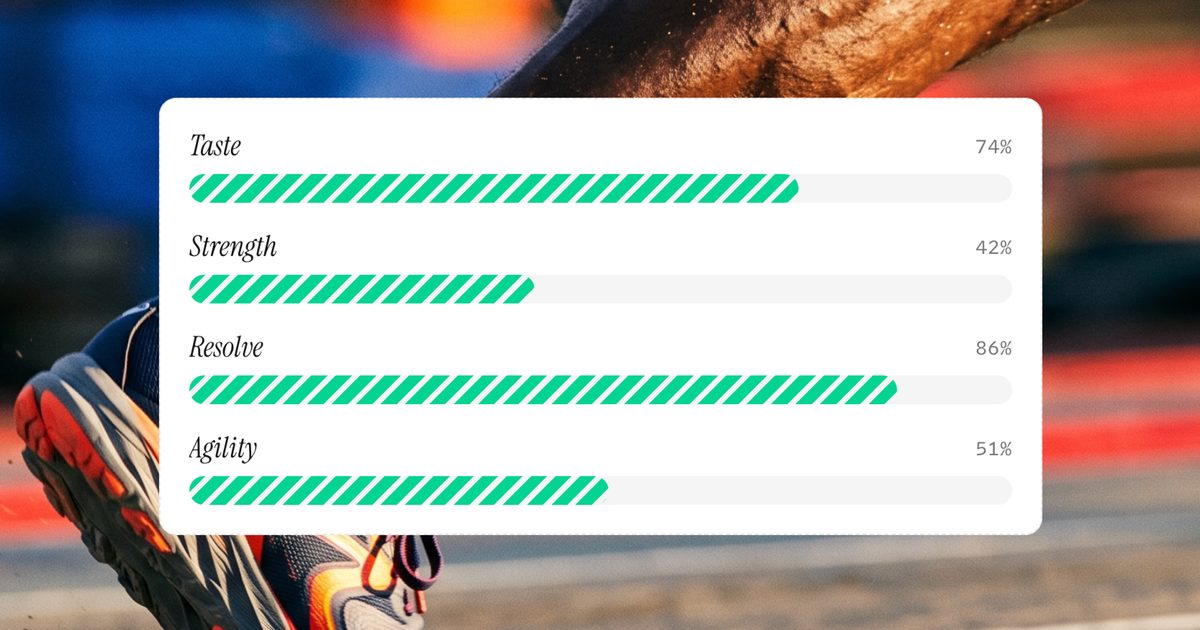
Refinery Studio
A customizable progress chart
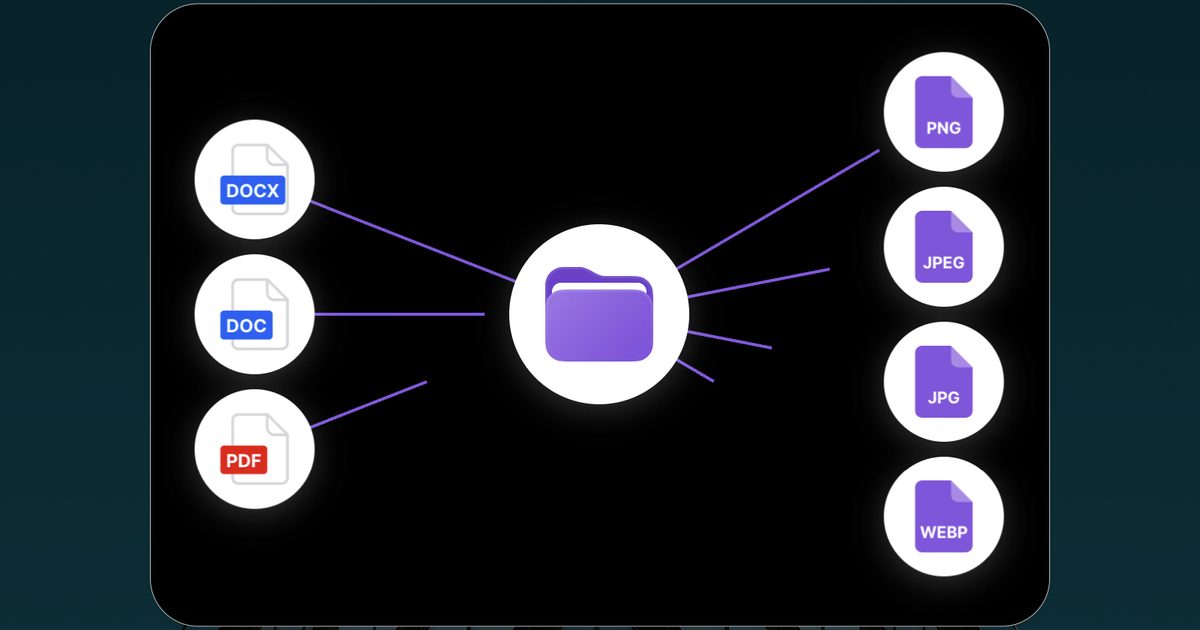
Dezainaz Inc.
Take full control of your integration visuals.
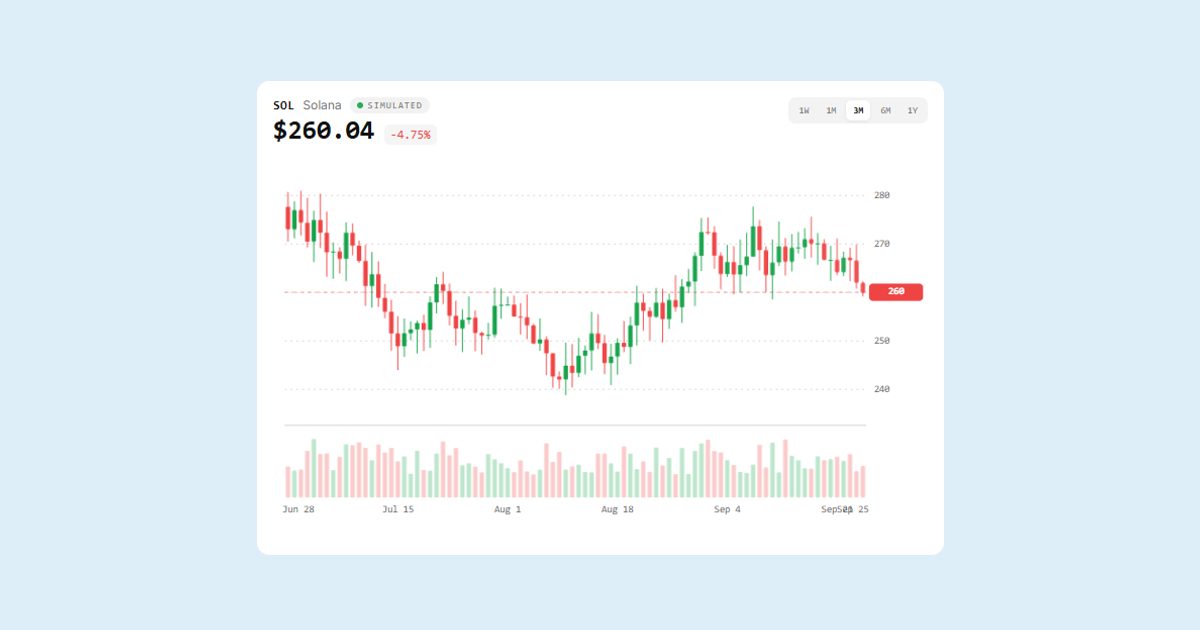
Karim Saif
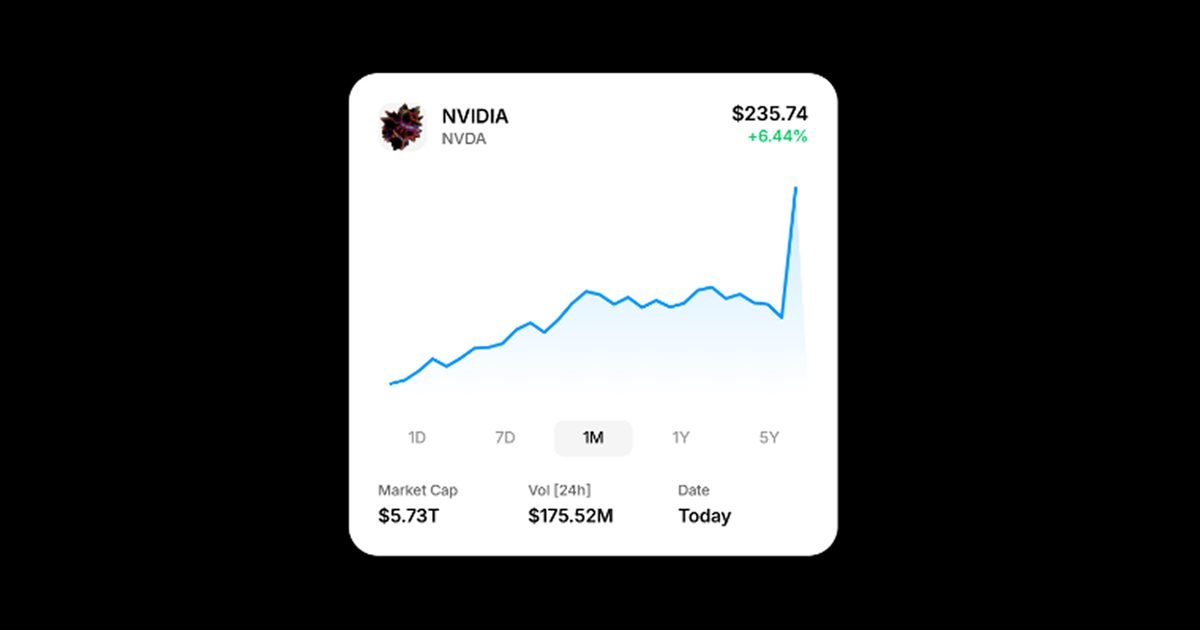
Responsive market chart
Modex Studio
StockChart is a clean modern Framer component with smooth graph animations, responsive layouts, interactive timeline controls, and stylish…
BrandingUp
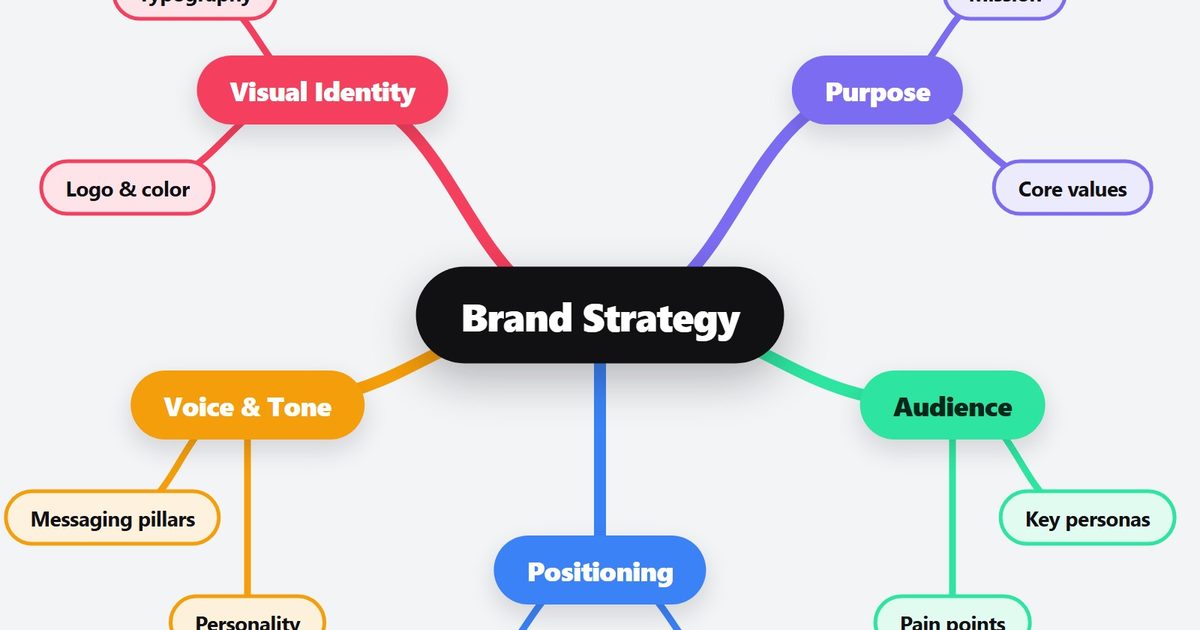
Auto-layout collapsible mind map
Savva Sicevs
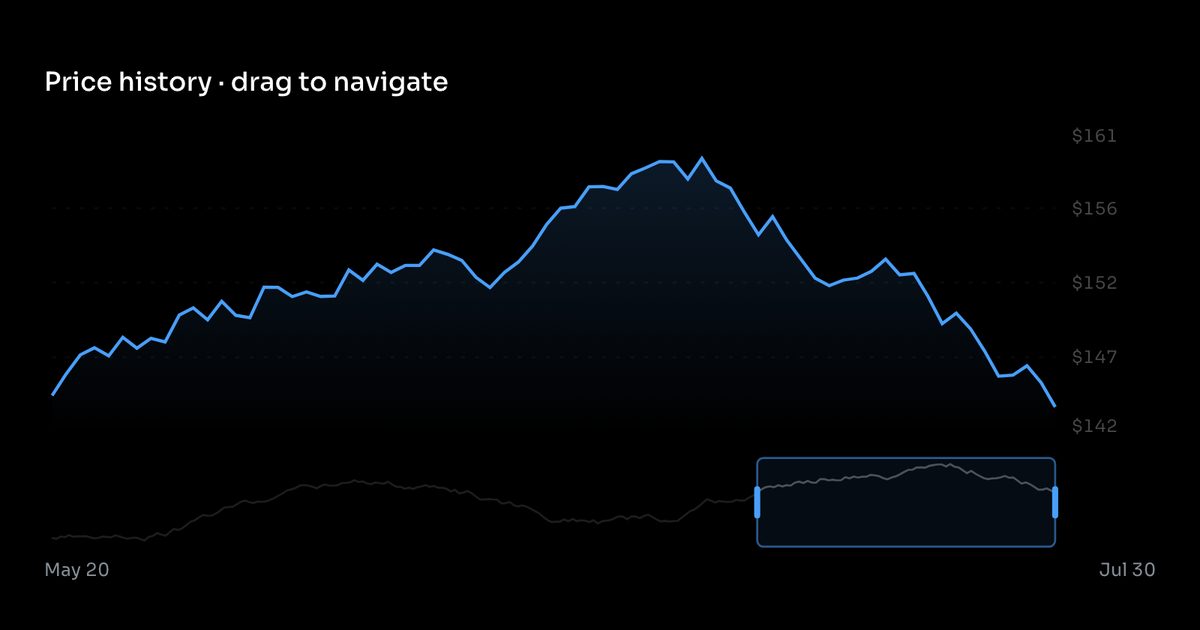
Price history with a brush window
Ævar Bernburg
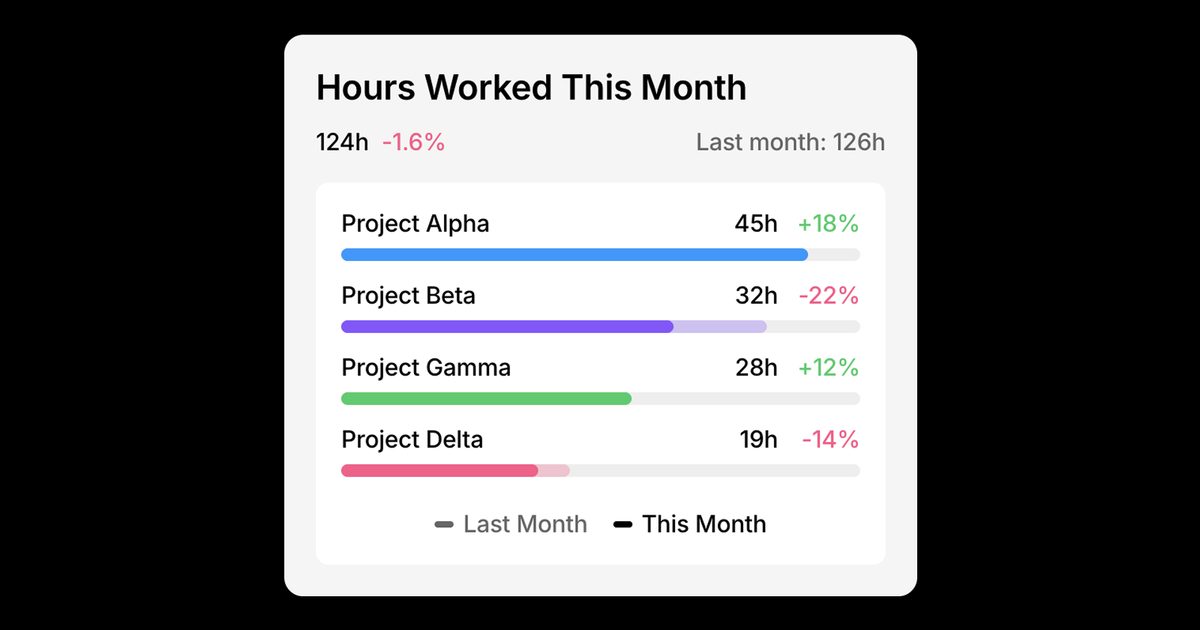
Project Hours Chart The Hours Worked Component displays total hours and project breakdowns in a clean, visual format.